Sunday, December 31, 2017

UnicodeDecodeError while reading CSV into Pandas

Hello,

A common error that frustrates a developer while reading CSV file with Pandas is this:-
UnicodeDecodeError Traceback (most recent call last)...UnicodeDecodeError: 'utf-8' codec can't decode byte 0x92 in position 9: invalid start byte
The Cause

The usual cause is because the CSV has some hidden special characters and pandas is unable to detect the right encoding system to read the file correctly.


The Solution

I was able to over come this error most of the time by open the CSV file in a text editor such as Sublime Text and re-save it with and encode system.

In Sublime Text, go to: File >> Save with Encoding >> UTF-8 (chose the right encoding for the file in question.)

Doing this means you have defined the encoding system for the file. In other word, you re-defined the file's encoding system which will allow pandas read it correctly.


That is it.
Good Luck

Thursday, December 28, 2017

The way forward for Land Surveying Profession in Nigeria

The way forward for Land Surveying Profession in Nigeria

There is no doubt, Land Surveying profession has experienced huge changes due to advancement in technology. This has lead experts in the field to modify its curriculum and nomenclature to Geomatics Engineering, Surveying and Geoinformatics, Geomatics etc.

Here is an extract from NASGL WhatsApp Group - National Association of Surveying and Geo-Informatics Lecturers (December, 2017)

Happy reading!

-------------------------------

Friday, December 22, 2017

Enable Legend window on QGIS Map Canvas

Hello there,
After styling your map analysis, you will want to add a legend or key to better communicate what is on the map to the map user/reader.

In QGIS, this is usually done through the "Print Composer". While this is excellent, the "Print Composer" dialog isn't an interactive mapping evironment. It is meant for final preparation of a map for printing or sharing in form of image/SVG/PDF.

In this post, we want an interactive legend layer separate from the "Layers Panel" on the map canvas so we can control map interactively to reveal some patterns with interfering with the main project "Layers Panel".

I will show you how to eanble the Legend dialog box using the python console with few lines of PyQGIS code.

Let get started...

Legend on QGIS Map Canvas
Start the "python console" enter the following codes...

from qgis.gui import *
root = QgsProject.instance().layerTreeRoot()
model = QgsLayerTreeModel(root)
view = QgsLayerTreeView()
view.setModel(model)
view.show()


This will start a GUI map Legend containing all the layer in the "Layers Panel". This especially good for interacting with the map canvas without obstructions from other setting on the "Layers Panel" (most especially if the map has large number of layers).

You can save the code as a .py file and run it anytime you want to start the Legend GUI window.

That is it!
Thanks for reading...


Wednesday, December 20, 2017

Creating 3D buildings model in QGIS

Creating 3D buildings model in QGIS

Hello there,
An easy way to wow your GIS client is to display his building mapping project modeled in 3D :).

Ok, on a more serious note, there are many reasons why you will model a map in 3D. In this article, an going to guide you on how to do it in QGIS software.

Let's get started..


Step 1:
Install the Qgis2threejs plugin through menu plugin manager (Plugins >> Manage and install plugins...). This plugin exports terrain data, map canvas image and vector data to your web browser. It allows you to view 3D objects in the web browser (You need a web browser which supports WebGL (Web Graphics Library)).


Step 2:
After isnalling the plugin, you can access it on the menu Web >> Qgis2threejs >> Qgis2threejs

Make sure you have you build layer loaded with attribute column for the builds height.


Step 3:
From the Qgis2threejs dialog window, select the layer you want to display, the building height attribute column, select a location to save the generated .html file and click on "Run" button.


That is it! The generated 3D model should now open on you default browser (as seen in the first image above) and you can always come back to manipulate other setting to get what you want.

Note: Your project coordinate reference system (CRS) should be in meters or the same unit of your building heights to avoid get a funny result.

thanks for reading.

Thursday, December 14, 2017

Switching to Monokai Color Scheme on SublimeText and RStudio


My Favorite IDE Color Scheme is: Monokai. The best color scheme, syntax highlighting and user interface theme for Sublime Text and Visual Studio Code, from the author of the original Monokai color scheme.

In this post, I will show you how to switch to this theme in both SublimeText and RStudio.


SublimeText: Go to Preferences >> Color Scheme and select Monokai


RStudio: Go to Tools >> Global Options >> Appearance >> Editor Theme and select Monokai


That is it!
Enjoy this beautiful  IDE Color Scheme.

Monday, December 11, 2017

Executing Python Script in RStudio - R + Python in one IDE

Hello there,

Without any doubt what-so-ever, the two most powerful data science programming tools are Python and R. How about if you could run these two in on Integrated Development Environment (IDE)?

That is what this post is all about. I will show you how you could run Python scripts right inside of a popular R environment.

R + Python in one IDE

A quick solution to this lies in RStudio. With the latest version of RStudio, you can use RStudio as a Python REPL. But first you need to download and install Python on your machine just the way you would do R.

RStudio is a free and open-source integrated development environment for R, a programming language for statistical computing and graphics. RStudio was founded by JJ Allaire, creator of the programming language ColdFusion (Source: WikiPedia).


To run R script in RStudio:
Because RStudio was originally made for R, it is fairly striaght forward to run R scripts. Just got to the "Comprehensive R Archive Network" (CRAN) web page to download R. Then also download and install RStudio.


To run Python script in RStudio:
To run Python in the same RStudio environment, go to the official Python web page and download it. During the installation, make sure that it is added to your system "Environment Variable" so that RStudio terminal could recognize it without you calling the full PATH all the time.

With the above in place, you can now write your python script in the RStudio "Script Pane" and save it with .py extension. Then run it and see the output on the "Console Pane".


As seen above, I import 'pandas' module and created a dataframe in the "Script Pane" and the result is displayed on the "Console Pane".

You can also use the interactive terminal to run python scripts by going to: Tools >> Terminal >> New Terminal. From the new terminal window that open, you can call the python interpreter and enter any python command just as you would do on cmd or python IDLE.


That is it!

Note: Apart fro R and Python, RStudio supports other programming languages such as JavaScript, SQL, etc.

Saturday, December 2, 2017

Downloading High Resolution Satellite Image Using Terra Incognita Software


Terra Incognita is a GPS mapping and management software that is available for download here. It is a program for downloading web source maps or local files maps for various programs or GPS devices.

In this post, I will show you how to use it to download High Resolution Satellite Images.


Monday, November 27, 2017

Bulk Install Python Libraries with a Single Command

Hello there,
Assuming you have a situation where you needed to install numerous library dependency on your python environment to be able to run an app. You can install the libraries one after the other using: pip install library_name.

However, where you where you have many libraries to install, then a handy command will be to run it once and installed all the dependency libraries without repeating same command/process over and over again.

Here I needed to install about 20 libraries so instead of doing one thing 20 times, i will use thais command to install all sequentially: pip install -r requirements.txt

How it works
First create a text file name it requirements.txt and type all the libraries with there versions as seen below...


Next, open cmd/terminal and run pip install -r requirements.txt

This will install all the libraries as typed in the requirements.txt text file.


That is it!

Sunday, November 12, 2017

Pandas Merge two Data frames based on common column values

Sometime back I had this "Combining multiple tabular data files together" situation at hand and I wrote about it then.

Now, there is another problem I have to solve.... It is similar to the above but not exactly the same. I will explain it below:-

The Problem

I have tow Data frames (tabular data) in which one is a subset of the other. That is to say second data frame (df2) is a subset of first data frame (df1).

Now, I need to merge them together based on a common column in the two data frames (df1 and df2) and also keep track of what row was in the main data frame and not in the subset data frame. This is more like saying:
- Remove rows from two Data frames that have uncommon column value
- To find rows in one data frame but not in another
- Find rows which don't exist in another data frame by multiple columns

Any how you look at it, above is the general idea!


The Solution

I solved this by using the pandas merge() method with the following flags/parameters: "how='left'" and "indicator=True".


This created a Data frame with an extra column name: _merge that contains two keywords 'both' (row contain in both data frames - df1 and df2) and 'left_only' (row contain in only the left data frames - df2).


Example:-

df_all = df1.merge(df2.drop_duplicates(), on=['col1','col2'], how='left', indicator=True)


That is it!

Wednesday, November 1, 2017

QGIS - Label Multiple Polygons with one attribute text


QGIS Label group of polygons with single text fro the attribute field


Suppose you have a vector layer that contains polygons with the same attribute values as seen below.


You don't want to name each of the polygons because the values are the same, instead you just want one name for the whole group of polygon as seen below...


To achieve this, create a new attribute field in the to control either the label string is turned on/show or off/hide the labels by assigning the value of 1 or 0.

1 is for: On/Show Label
0 is for: Off/Hide Label


Now, after creating the attribute field, take note of the field name and go to the layers label property tab. Define and enable the field label as usual and under: Rendering >> Data Define >> Show Label, select the label control field you created above and save your changes.


All the polygons with the value of "0" will have there labels turned off/hidden only those with value of "1" will be on/showing.


Note: There are many ways to do this, the above is perfect if you want to have control over your label within QGIS map canvas.


That is it.
Thank you for reading.

Tuesday, October 24, 2017

Map of Nigeria States' Senatorial Districts

Map of Nigeria Senatorial Districts by State - You may also be interested in Maps of Various States and their Local Governments with electoral wards in Nigeria.

The Senate is the upper house of the Nigeria's bicameral legislature, the National Assembly of Nigeria. The National Assembly (popularly referred to as NASS) is the nation's highest legislature, whose power to make laws is summarized in chapter one, section four of the 1999 Nigerian Constitution. It consists of 109 senators: the 36 states are each divided in 3 senatorial districts each electing one senator; the Federal Capital Territory elects only one senator (Source: WikiPedia).

Here are the maps or visual representation for all the 36 states Senatorial Districts as defined by INEC.

Basically, it is this table provided by INEC listing the NAME OF SENATORIAL DISTRICTS in Nigeria that am representing in a more meaningful format as a map.

Wednesday, October 18, 2017

Domain-Specific Language (Geographic Markup Language - GML)

Hello there,
According to wikipedia: A domain-specific language (DSL) is a computer language specialized to a particular application domain. This is in contrast to a general-purpose language (GPL), which is broadly applicable across domains.

There is a wide variety of DSLs, some examples include:-
~ HTML
~ Logo for pencil-like drawing
~ Verilog and VHDL hardware description languages
~ MATLAB and GNU Octave for matrix programming
~ Mathematica, Maple and Maxima for symbolic mathematics
~ Specification and Description Language for reactive and distributed systems
~ spreadsheet formulas and macros
~ SQL for relational database queries
~ YACC grammars for creating parsers
~ regular expressions for specifying lexers
~ the Generic Eclipse Modeling System for creating diagramming languages
~ Csound for sound and music synthesis
~ GML - Geographic Markup Language
~ KML - Keyhole Markup Language

Thursday, October 12, 2017

Most profitable python programming skill in 2017 and beyond

Hello there,

This blog post will address the question:-
~ What Python skills are in demand in the freelance job market?
~ What Python skills are people/companies looking for?

I will share my python programming freelance experience since the beginning of this year 2017. Am also confident that this experience will last longer and remain relevant beyond 2017...

Python is one of the programming languages that is on the rise and there's really a demand for Python programmers out there. But, the question is what aspect or area of application is more profitable at the moment and in the near future?

Applications for Python
First of all, python is applicable in many areas of our day-to-day activities. Here is a high level overview of python application domain:
1) Web and Internet Development - Django, flask, Pyramid etc
2) Scientific and Numeric - SciPy, Pandas etc
3) Education - very good for teaching programming
4) Desktop GUIs (Graphical User Interfaces) - TkInter, wxWidgets, PyQt, Kivy etc
5) Software Development - SCons, Buildbot, Apache Gump etc
6) Network Administration

Read more on the official website...

Friday, October 6, 2017

Scraping StaticGen.com with Python

This is a short Python Web Scraping Tutorial

We will learn how to scrape data from this website StaticGen and have the data saved into a CSV file for further processing.

Let's get our hands dirty...

Prerequisite

You should already have at least some basic knowledge of the following:-
1- HTML and CSS
2- Python


Inspecting the site's HTML structure

Load the website on the browser and study the html structure. Use what ever tool or browser for this, I used Google Chrome browser and it looks like below:-


Ctrl+U to view source code


FireBug to view html code


Html Inspector (Ctrl+Shift+I)


As you may have noticed, the required dataset to be scrapped are arranged in rows and columns on the web page. This makes things easier since we have a consistent pattern to follow.

Wednesday, October 4, 2017

Dynamically generate HTML file from CSV data using Python

Hello there,

Assuming you have bunch of dataset in a CSV file and you want to dynamically add them on to a HTML file to upload on a web server so the someone on the other part part of the world could access and view it on the web. And you don't want to share the raw CSV file instead you want a to share a viewer friendly file such HTML, then this article is for you.

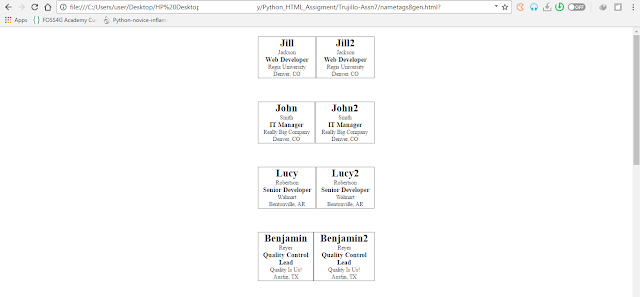
Below is the out of the script that collects data from a CSV file and populate a HTML file.


The script is as simple as below...

So, basically we just import the CSV module and read in the csv file. Then we used the open() method to create a html file in the working directory and write lines of standard html code in it.

import csv


csv_list = []
      
try:
    with open('registrant_data.csv', 'rU') as csvfile:
        readCSV = csv.reader(csvfile)
        for row in readCSV:
            csv_list.append(row)
 # ========= Create html file ================

    with open('../nametags8gen.html','w') as html8:
        html8.write('<html>')
        html8.write('<head><title>Title of the page...</title> <link rel="stylesheet" type="text/css" href="./nametags8gen.css"></link></head>')
        html8.write('<body>')
 # more algorithms to fetch csv records...

        html8.write('</html>')
        html8.write('</body>')
         

To generate new html with new contents, just update the CSV file and run the script.

That is it.
Thanks for following...

Sunday, September 24, 2017

Resize image dynamically when frame is maximized in wxPython

Hello,

I will work you through on how you will "Resize a wxStaticBitmap image dynamically when frame is maximized in wxPython

Here I have two StaticBitmap images placed side-by-side in box sizers. So, we want the size of the images to scale appropriately with the frame whenever it is been maximized.

The code....

import wx

class MyFrame2 ( wx.Frame ):

    def __init__( self, parent ):
        wx.Frame.__init__ ( self, parent, id = wx.ID_ANY, title = wx.EmptyString, pos = wx.DefaultPosition, size = wx.Size( 500,300 ), style = wx.DEFAULT_FRAME_STYLE|wx.TAB_TRAVERSAL )

        self.SetSizeHintsSz( wx.DefaultSize, wx.DefaultSize )

        bSizer11 = wx.BoxSizer( wx.HORIZONTAL )

        self.m_bitmap3 = wx.StaticBitmap( self, wx.ID_ANY, wx.Bitmap( u"img/im1.jpg", wx.BITMAP_TYPE_ANY ), wx.DefaultPosition, wx.DefaultSize, 0 )
        bSizer11.Add( self.m_bitmap3, 1, wx.ALL|wx.EXPAND, 5 )

        self.m_bitmap4 = wx.StaticBitmap( self, wx.ID_ANY, wx.Bitmap( u"img/im2.jpg", wx.BITMAP_TYPE_ANY ), wx.DefaultPosition, wx.DefaultSize, 0 )
        bSizer11.Add( self.m_bitmap4, 1, wx.ALL|wx.EXPAND, 5 )


        self.SetSizer( bSizer11 )
        self.Layout()

        self.Centre( wx.BOTH )

    def __del__( self ):
        pass

app = wx.App(0)
MyFrame2(None).Show()
app.MainLoop()

When you first launch the GUI it is like this....


Thursday, September 14, 2017

The Geo in PyCon Nigeria 2017

Hello,

I am privileged to be among the speakers at this year's python conference and the title of my talk is "Using Python for GIS and Remote Sensing Operations".

As I Geo aware individual, I was impressed with the organizers especially the guy behind the conference Venue page.


He did not only added geospatial technology on the page, but he also encouraged users to make use of the tool to make there live easier while locating the conference venue.

The web page is based on python Django web framework (Pinax/Symposion) and on these bases of python & GIS relationships, I decided to write this blog post.


What I did on the Venue Page

On the page there is a "Get Direction" tool, so i used it to get the direction from Abuja where I am coming from.


There and then I have a quick idea of where am going to and how long it will take me to reach there by road or air as seen above.

I also get the direction of my hotel (Presken Hotel) location to the venue and I observed there are two location of the hotel having similar name. However, based on the address provided I realized the correct on is with the name "Presken Hotel (Awolowo way)" and it is about 2km (5min drive) from the venue.


Thank God for Google map, everyone can at least do or interact with GIS without installing any heavy software.


You can find the presentation here: https://github.com/forum2k9/pycon-ng-2017

Thursday, August 31, 2017

Next Step after Learning the Basics of Python Programming

Hello there,

Today I want to share with you things you could do after completing the fundamentals in Python. There is always this dilemma on what NEXT after learning and completing the basic fundamentals of Python Programming.

I will attempt to solve this using my experience after being in similar situation few years ago.

Shortest Solution


The shortest answer will be that: its depend on what you want to use python for, learn related libraries in that niche. For example, if your in the Geospatial/GIS industry then go ahead and search PyPI for related libraries and learn them.


Long Solution

Now its time to program something useful to you in Python and put that theoretical knowledge to accomplishing something practical!

Pick any topic that interests you and learn the libraries related to it. There are many tutorials and documentation out for just about any library you wish to learn.

As you go through tutorial or documentation with code in it, type in all of the code and make it work. That's how I do it. That's how every programmer does it.


Find a project that interests you and try to solve it using Python. It could be in any of the following fields:-

~ Web and Internet Development
~ Scientific and Numeric
~ Education
~ Desktop GUIs
~ Software Development
~ Business Applications

Python Project Ideas

Here you will find list of practical projects to try out. 


Tuesday, August 15, 2017

Reading JSON file into Pandas DataFrame

I wanted to read in a JSON object on a python pandas dataframe for further processing. So, I tried the default pandas read JSON method: read_json('file.json'), but I got just the JSON strings returned in the dataframes's row as seen below. That isn't what I was expecting....


Fortunately for me, pandas has a solution for this in its json_normalize class that “Normalize” semi-structured JSON data into a flat table.


So, I read the JSON file and applied the "json_normalize()" class and boom my semi-structured JSON data was converted into a flat table as seen above.

That was it!

Sunday, August 6, 2017

Convert Projected coordinates (Northings/Eastings) to Geographical (Latitude/Longitude) using Python

Generally, there are two types of coordinate systems used to represent Geospatial data namely:-
1) Geographical Coordinate Systems - Polar coordinates assumes the earth is spheroid/geoid/ellipsoid/curve (Latitude/Longitude). Example: World Geodetic System (WGS) 1984. Geographic coordinate systems are based on a spheroid and utilize angular units (degrees).

2) Projected Coordinate Systems - Rectangular coordinates assumes the earth is flat (Northings/Eastings).Example: Universal Transverse Mercator (UTM) Zone 33. Projected coordinate systems are based on a plane (the spheroid projected onto a 2D surface) and utilize linear units (feet and meters)


Thursday, August 3, 2017

Download Nigeria Geo dataset for States, LGA and Ward levels

Hello,
Are you looking for a complete and comprehensive Geo dataset of Nigeria? Are you looking for complete map of Nigeria at States, LGA and Ward levels?

If yes, then you have come to the right website. Here you can download complete map of Nigeria at States, LGA and Ward levels in different file formats including image files, PDF, shapefile, CSV, GeoJSON, XML etc.

Check out the samples below and download. If you have special request, feel free to contact me and I will convert and provide it for you asap.

Download ward map in shapefile format from here.

Tuesday, August 1, 2017

Web Mapping - case study of Ahmadu Bello University (ABU) Zaria Main Campus (Samaru, Sabo LGA Kaduna State)

Hello there,

In today's post, I will share how to produce a Campus Web Map using free and open source tools.

I will use ABU Zaria as an example. Let's get started....

You need the vector (shapefile) map of the campus. If you don't have one, you can easily obtain a copy from the ABU GIS unit or you can digitize your copy from available google earth satellite image.

You can use any GIS software for this... here I use a free software called QGIS.


There are several free and open source methods of deploying the shapefile map to the web. Some notable method am going to discuss in few moment include:-
1) Google Map Engine
2) QGIS2Web plugin
3) Open Street Map
4) Python Folium Library

Choose any of the methods above to create your web map (there are many guide and tutorials on the internet or contact me for help).

Happy mapping.

Thursday, July 6, 2017

Setting up virtual environment (virtualenv) for python app development

When working on fairly large app in python, it is a good practice to create/setup an isolated python environment (called virtual environment - virtualenv) for development.

There are many long term reason for setting up a python's virtual environment (virtualenv) for any project you are working on. The notable once include:
1) When you have to experiment with something new.
2) When you want to use two different versions of package and compare them.
3) Virtualenv really shines when you have a number of projects, and don't want them to all share the same Python installation. For example, you could have two project with conflicting requirements.
4) Virtualenv will let you define isolated Python runtime environments without harming the root or system python installation. This comes in handy when deploying several python applications and you want to isolate the different environments. Typically this is needed when runtime dependencies differ between frameworks or libraries in different applications.

Creating a virtual environment

Step 1: Create a folder where you want to have the python virtual environment
Step 2: Open CMD or terminal window in that folder
Step 3: Enter "virtualenv name_of_folder" on the cmd/terminal

At this point, you did have a virtual environment created.


Using a virtual environment

Step 1: Open CMD or terminal window in that folder
Step 2: Enter "folder_name\Scripts\activate"
Step 3: To deactivate, simply enter "deactivate"
Step 4: To install packages enter "pip install package_name"
Step 5: To view the install packages enter "pip freeze"
Step 6: To save the install packages to file, enter "pip freeze > file_name.txt"


That is it!

Wednesday, July 5, 2017

QGIS - Restore Missing Vector menu such as: Geometry Tools

Hello,

There is a bug in the 2.16.0 Nodebo version of QGIS. This bug hides some vector processing tools (GDAL tools) found under the "Vector" menu. As already reported here... on the QGIS issues tracking page. This is caused as a result of installing "processing tools" as an external plugin.


Here is how to fix it

To fix this, go to "Plugins" menu and search for "Processing" plugin and enable it.


That is it!
Happy mapping...:)

Thursday, June 22, 2017

How to make Custom Google Map of Nigeria displaying the state capitals

In this post, I will guide you to make a customized Google map displaying the capitals of all the states in Nigeria with additional information attached to each state capital.

I will also show you how to embed it to any html web page.

Let's get started...


Requirements
1) A Google account
2) CSV file containing the states information including longitude and latitude of the state capitals


Friday, May 26, 2017

Elshayal Smart GIS and Google Earth Compatibility Error [FIXED]

There has been serious complains on this error: *** Please be sure that Elshayal Smart GIS and Google Earth are opened and running as the same, either as adminstrators or as not adminstrators. ***

With this error, there are fear that the Elshayal software is not longer useful for downloading of free images from Google Earth. That is wrong, and here I am going to share with you the solution to fix this error.


This error is largely due to the usage of non-compatible versions of Elshayal Smart GIS and Google Earth.

At the moment of writing this post, the latest compatible versions of the software are:
Elshayal Smart GIS = 17.011
Google Earth = 7.1.7.2606


You can get the latest compatible versions from the official blog here.


Are you still having troubles? Feel free to let me know. I will help you download your images, contact me by email or phone: umaryusuf49@gmail.com or +2348039508010


Thanks for following

Sunday, May 14, 2017

How to setup a Geospatial Programming Blog - Served with "Static Website Generators"

How to setup a Geo-spatial Programming portfolio Blog that scales better than the traditional blogs

Blogging is one of the most important things that any aspiring GIS programmer or Geo-data scientist should be doing on a regular basis. It can be a fantastic way to demonstrate once skills and learn topics in more depth.

There are various software for creating your Geo-Data Science blog. The software that helps you create and publish your blog is called a Content Management System (CMS), Some are free and some cost money.

One common thing with CMS is that, they heavily depend on server to deliver contents. That is a request has to be sent to a database and responses are sent in return each time a use perform an action on the blog. This can be time consuming and over killing for a static geo-data content blog.

As a Geospatial programmer, if you really want to setup a GIS scripting oriented blog that scales very well. Then look beyond server centric CMS blog engines such as Blogger, Joomla, WordPress, Drupal etc. Instead choose a "Static Website Generators" that gives room for increasing both speed and uptime, and managing static sites with version control systems like Git means the process of creating and updating sites is highly efficient.

Static site generators allow a user to create HTML files by writing in a markup language and coding template files. A static website generator combines a markup language, such as Markdown or reStructuredText, with a templating engine such as Jinja, to produce HTML files.


Open-Source Static Site Generators

There are several of them, a comprehensive list is available at: www.staticgen.com

Since this blog is about python Programming, I will list those static site generators written in Python programming language below. Later on, I will cover how to create a blog using Python, how to create posts using Jupyter notebook, and how to deploy the blog live using Github Pages.


List of Python powered static site generators

1. Pelican - www.blog.getpelican.com/
2. MkDocs - www.mkdocs.org/
3. Cactus - www.github.com/koenbok/Cactus/
4. Lektor - www.getlektor.com/
5. Hyde - www.hyde.github.io/
6. Nikola - www.getnikola.com
7. Sphinx - www.sphinx-doc.org/
8. Frozen-Flask - www.pythonhosted.org/Frozen-Flask/
9. Blogofile - www.blogofile.com
10. Acrylamid - www.posativ.org/acrylamid/
11. Tinkerer - www.tinkerer.me
12. Tags - www.tags.brace.io/
13. staticjinja - www.staticjinja.readthedocs.org/en/latest/
14. Urubu - www.urubu.jandecaluwe.com
15. Grow - www.grow.io/
16. Tarbell - www.tarbell.io
17. wok - www.wok.mythmon.com/
18. Statik - www.getstatik.com/
19. QPage - www.qpage.ir
20. drupan - www.github.com/fallenhitokiri/drupan
21. Prosopopee - www.github.com/Psycojoker/prosopopee
22. PyKwiki - www.pykwiki.nullism.com
23. PieCrust2 - www.bolt80.com/piecrust
24. Poole - www.bitbucket.org/obensonne/poole/
25. Pagegen - www.pagegen.phnd.net
26. django-distill - www.github.com/mgrp/django-distill
27. Halwa - www.github.com/mhlakhani/halwa
28. Blended - www.jmroper.com/blended/
29. Blo - www.github.com/savuir/blo
30. YASBE - www.github.com/underr/yasbe
31. Bang - www.github.com/squdle/Bang
32. Rocadocs - www.rocadocs.com
33. BootDown - www.project.geekweaver.com/


Creating a Geo-Data Science portfolio blog will improved your career more than anything else and land you your dream job while doing the work you love.


Thanks for following.

Saturday, April 29, 2017

How do I do that in ArcGIS and QGIS - Learn both ArcGIS and QGIS Simultaneously

According to WikiPedia, there are two major categorization of Desktop GIS software namely:-
1- Commercial or Proprietary GIS software
2- Open Source GIS software

Over the years, the leading Desktop GIS software for the two categories above are ESRI ArcGIS and QGIS.

In this blog post, I will show you how to do basic GIS operations in both ArcGIS and QGIS. If you are interested in knowing the difference between the two software, here are some interesting articles on the internet I have found:-
a) QGIS v ArcGIS
b) 27 Differences Between ArcGIS and QGIS – The Most Epic GIS Software Battle in GIS History
c) ArcGIS vs QGIS – 10 Most Important Differences Between ArcGIS and QGIS
d) How does ESRI ArcGIS (proprietary) compare with Quantum GIS (QGIS) (open source)?
e) GIS lounge - QGIS versus ArcGIS

So, this post isn't about which is the best GIS software, instead it will address common questions in the form of "How do I do that in ArcGIS and QGIS". I will go over how you can perform some of the very basic GIS tasks in both ArcGIS and QGIS, and you will decide at the end which software approach is easier and better for you.

Along the way, you will be learning both ArcGIS and QGIS software simultaneously.

Lets get started...


Sunday, April 23, 2017

Installing wxPython on Python 3.x

Few years ago I wrote this blog post on "How to install wxPython (Phoenix) on Python 3.x". Since then, a lot has happened including the release of "wxPython 4.0.0a1"


So, today I decided to install the latest alfa release on my python 3 anaconda setup. I went to wx PyPi url downloaded the wheel file locally and ran: pip install wheel_file_name to install successfully as seen below.


I tested the installation, by importing wx and it work perfectly.


Congrats WX is now officially on python 3