Tuesday, June 29, 2021

GIS Programming with Python and QGIS - Part 3

GIS Programming with Python and QGIS - Part 3 >> The PyQGIS module

If you missed Part 1 and Part 2 read them before you continue reading...

In this part I will cover the following topics:-
1~ Introduction to PyQGIS
2~ Basic GIS Operations using pyqgis

Let's get started...


1~ Introduction to PyQGIS
PyQGIS is the official python module for the QGIS software. It allows you to perform spatial operations and automate spatial processes in the QGIS software.

The official python documentation is available on this website url (the C++ documentation is available here. Some notable resources for learning to use the module includes:-
i) PyQGIS developer cookbook - part of QGIS Documentation
ii) PyQGIS Programmer's Guide by Gary Sherman
iii) PyQGIS 101 by Anita Graser
iv) Open Source Option YouTube Channel on PyQGIS

The resources above are good enough to get you started.


2~ Basic GIS Operations using PyQGIS
Lets take a look at some common operations we usually do in QGIS software and see how we can do the same in PyQGIS.

i) Loading and rendering shapefile in PyQGIS
The two important methods needed to load a vector layer onto the map canvas are: QgsVectorLayer(vector_file, 'DISPLAYNAME', 'ogr') and QgsProject.instance().addMapLayer(layer)

See proper usage below:-

# Path to the shapefile...
vector_file = r"C:\Users\Yusuf_08039508010\Desktop\Working_Files\GIS Data\NGR\Nig Adm\NGA_adm2.shp"

# Create vector layer object...
layer_1 = QgsVectorLayer(vector_file, 'DISPLAYNAME', 'ogr')

# Add shapefile to map canvas...
QgsProject.instance().addMapLayer(layer_1)
If you want to see a more useful scenario of adding/loading vector layers into qgis layer panel using pyqgis see this page.


We can also interact with the project file (.qgs or .qgz) as follow:-
# Create project instance object
project = QgsProject.instance()

# Get project file path name
project.fileName()

# Get project file base name
project.baseName()

# Set project file to new title
project.setTitle('New Title Name...')

# Get lenght/number of layers in a project layer panel
len(project.mapLayers())

# Find more attribute and methods for QgsProject
dir(QgsProject.instance())


ii) Accessing Shapefile Attributes Table
To access the attribute table fields/column use the layer_1.fields() method like this in a forloop expression...

# get attribute columns names
for f in layer_1.fields():
    print(f.name())
This will printout all the field/column names. You can manipulate individual column from the temporary variable f.


Saturday, June 26, 2021

Function in Python, Javascript and R

A function is what make a code reusable, you write a piece of code once and you use it as many times as you want. These function can either be built-in or custom constructed (user-defined) functions.

Programming languages (Python, Javascript and R in this case) have built in functions. These are functions that are already available by default within the language engine for you to use. There are many of these built-in functions, just to give an example of one lets look at a function that calculates the square root of a number.


Built-in square root function in Python

In python, this function is available in the built-in math module.
import math 
print(math.sqrt(25))

User-defined/Constructed square root function in Python

def sqrt_num(x):
    num_sqrt = x ** 0.5
    print(num_sqrt)

sqrt_num(25)


Built-in square root function in JavaScript

In JavaScript, this function is available in the built-in math library.
Math.sqrt(25);

User-defined/Constructed square root function in JavaScript

function sqrt_num(x){
    return num_sqrt = x ** 0.5;
}


Built-in square root function in R

In R, this function is directly available as seen below.
sqrt(25)

User-defined/Constructed square root function in R

sqrt_num <- function (x){
    num_sqrt = x ** 0.5
    print(num_sqrt)
}


That is it!

Monday, June 21, 2021

Python data wrangling examples (Practical Exercises with Solutions)

Data wrangling (aka data munging or data preprocessing) is the process of transforms “raw” data into a more suitable form ready for analysis. It is a vital skill in completing many data science project.

Some data wrangling methods we will use in this tutorial are: filtering, gathering/collecting, merging, grouping, concatenating, transforming, manipulating, extracting, formatting, chaining, subset, handling missing data, summarizing, combining, splitting etc. Depending on your data wrangling project objective, you will only utilize a handful of these methods per project.

Here below, you will find some data wrangling Exercises and Solutions. Lets get our hands dirty....


The dataset: All the data used are available for download from the github page.


Exercise 1:

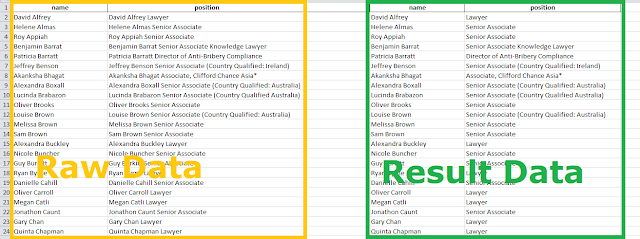
Extract the "positions" of the following list of lawyers table into a new column.


Solution 1:-

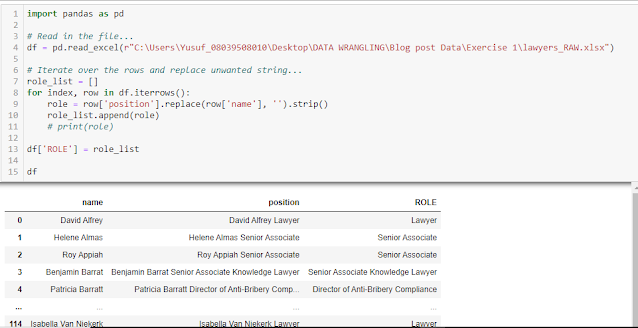
We will read the file into dataframe and then replace the names from column 'name' by empty string in column 'position'.

import pandas as pd

# Read in the file...
df = pd.read_excel(r"C:\Users\Yusuf_08039508010\Desktop\DATA WRANGLING\Blog post Data\Exercise 1\lawyers_RAW.xlsx")

# Iterate over the rows and replace unwanted string...
role_list = []
for index, row in df.iterrows():
    role = row['position'].replace(row['name'], '').strip()
    role_list.append(role)
    # print(role)

df['ROLE'] = role_list

df

Thursday, June 17, 2021

PyQGIS - Convert from one vector format to another

 If you got a valid QgsVectorLayer, then the following class "QgsVectorFileWriter.writeAsVectorFormat(...)" is used to convert any gdal/ogr supported vector driver format to another.

There are many vector drivers supported by GDAL/OGR as listed on this page.

For example, to convert GeoJSON to Shapefile, we will read the GeoJSON file using QgsVectorLayer and convert it to ESRI Shapefile driver using QgsVectorFileWriter.writeAsVectorFormat(...) as demonstrated below.


# Convert GeoJSON to SHP
input_shp = QgsVectorLayer(r"C:\Users\Yusuf_08039508010\Desktop\US Zip Codes\ak_alaska_zip_codes_geo.min.json","polygon","ogr")
input_shp.isValid() 

QgsVectorFileWriter.writeAsVectorFormat(input_shp, r"C:\Users\Yusuf_08039508010\Desktop\US ZipCode\poly.shp" , "UTF-8", input_shp.crs(), "ESRI Shapefile")

# ----------------------------------------- for Bulk Conversion
import glob

input_files = glob.glob(r'C:\Users\Yusuf_08039508010\Desktop\Working_Files\GIS Data\US Zip Codes\*.json')
for f in input_files:
    out_filename = f.split('\\')[-1].split('.')[0]
    input_file = QgsVectorLayer(f, "polygon", "ogr")
    
    if input_file.isValid() == True:
        QgsVectorFileWriter.writeAsVectorFormat(input_file, rf"C:\Users\Yusuf_08039508010\Desktop\Working_Files\SHP\US ZipCode\{out_filename}.shp", "UTF-8", input_file.crs(), "ESRI Shapefile")
    else:
        print(f, 'is not a valid input file')
        
print('Done Processing..., ', f)


Note that "QgsVectorFileWriter.writeAsVectorFormat(...)" takes in the following; the input file, the output file, the encoding, the coordinate system, the output file driver.

That is it!

Tuesday, June 15, 2021

Python variables in HTML String Literals

Using Python Variables in HTML multi-line Python string

Running the script below will generate an HTML page like this...


# ------------- HTML Template ------------------------
html_head = '''

<!doctype html>
<html lang="en">
  <head>
    <!-- Required meta tags -->
    <meta charset="utf-8">
    <meta name="viewport" content="width=device-width, initial-scale=1">

    <!-- Bootstrap CSS -->
    <link href="https://cdn.jsdelivr.net/npm/bootstrap@5.0.1/dist/css/bootstrap.min.css" rel="stylesheet" integrity="sha384-+0n0xVW2eSR5OomGNYDnhzAbDsOXxcvSN1TPprVMTNDbiYZCxYbOOl7+AMvyTG2x" crossorigin="anonymous">

    <title>{main_title}</title>
  </head>
  <body>

'''


html_tail = '''

    <!-- Option 1: Bootstrap Bundle with Popper -->
    <script src="https://cdn.jsdelivr.net/npm/bootstrap@5.0.1/dist/js/bootstrap.bundle.min.js" integrity="sha384-gtEjrD/SeCtmISkJkNUaaKMoLD0//ElJ19smozuHV6z3Iehds+3Ulb9Bn9Plx0x4" crossorigin="anonymous"></script>

  </body>
</html>

'''


html_body1 = '''
<div class="container">

    <div class="row">
      <div class="col-3">
        <h3>{main_title}</h3>
        <img width= '250px' src="{main_image}">
        <p>{main_description}</p>

      </div>
      
      <div class="col-9">

'''


html_body2 = '''
      
        <b>{item_date}</b>
        <h3>{item_title}</h3>
        <p>{item_description}</p>
        <audio controls> <source src="{item_mp3_file}" /> </audio>
        <hr>

'''

html_body3 = '''
      </div> \n
    </div>
</div>
'''
# -------------------------------------------------------

html_filename = 'index'
main_title = 'The HTML title' 
p_description = 'Placeholder.com is a free image placeholder service for web designers, serving billions and billions of images each year. You can specify image size & format (.GIF, .JPG, .PNG, .WEBP), background color & text color, as well as the text.'
main_image = 'https://via.placeholder.com/150'
p_date = '12-06-2021'
p_title = 'How To Use Our Placeholders'
main_description = 'Placeholder.com is a free image placeholder service for web designers, serving billions of images per year.'
p_mp3 = 'https://file-examples-com.github.io/uploads/2017/11/file_example_MP3_1MG.mp3'


with open(f'{html_filename}.html', 'w', encoding='utf-8') as html5:
    html5.write(html_head.format(main_title=main_title))

    html5.write(html_body1.format(main_title=main_title, main_description=main_description, main_image=main_image))
    html5.write(html_body2.format(item_date=p_date, item_title=p_title, item_description=p_description, item_mp3_file=p_mp3))
    html5.write(html_body3)

    html5.write(html_tail)

print('Finished...')


That is it.

Thursday, June 10, 2021

PyQGIS - Attribute Group Counter

 If you have a vector shapefile layer that has an attribute which is a categorized group for other attributes and you want to get the count/number of items in each group, then here is a quick script to get you the result.

A typical scenario where you will find this useful is when you count counties in a state or similar scenario. Assuming we have a vector layer with a category attribute column named "group" as seen below, then we can count the occurrences of each group using the following script.


from collections import Counter

# Get active vector layer...
layer = iface.activeLayer()

# Lets count the number of features...
print(layer.featureCount())

# Lets check the field names...
for f in layer.fields():
    print(f.name())

# Get attributes into a list...
attr_list = []
for feature in layer.getFeatures():
    attr_list.append(feature['group'])

# Count item occurrences using 'collections.Counter'
attr_count = dict( Counter(attr_list) )
print(attr_count)

The primary logic here is in counting item occurrences within a list using collections.Counter module as seen below.


That is it!

Monday, June 7, 2021

PyQGIS for fun - lets write fun little scripts in pyqgis

 There are already many pyqgis scripts that allow you interact with various spatial datasets. In this post, I want to take a look at something different just for fun and hopefully that will help you understanding pygis ecosystem!

So we won't be interacting with core GIS data per se, instead we will write some fun little projects in PyQGIS that has little or nothing to do with GIS data directly.

These project will help us understand pyqgis and the QGIS interface as a whole. Lets get started...


Note: When you are scripting in PyQGIS, you are directly or indirectly using three technologies namely: Qt, PyQt and PyQGIS

Qt is a widget toolkit for creating Graphical User Interfaces (GUI) in C++.

PyQt is the Python interface to Qt. PyQt provides classes and functions to interact with Qt widgets.

PyQGIS uses PyQt instead of the default python GUI library (TkInter) that comes with most python installations. TkInter was removed from the python that comes with QGIS, the last time I check on QGIS version 3.16 it throughs error like so...


I think the QGIS developers don't want you to use another GUI tool kit within QGIS (which I think they are right, as doing this will only introduce another layer of complexity), sorry TkInter lovers 😊.