Saturday, August 26, 2023

How to Calculate Scale Factor for Scaling Objects in AutoCAD

 If you are scaling an object in AutoCAD using the "SCALE" command, you will be prompted to enter scale factor. In as much as the scale factor could be entered on the fly, it would be proper to know the exact value that needed to be entered to scale an object in a precise manner.


To calculate the 'Scale Factor', lets consider the points P1 and P2 seen above. The distance expected is 407.97m, but when measured using the measuring tool the measured distance was 161.64m.

So, the 'Scale Factor' will be Expected distance ÷ Measured distance. That is: 407.97/161.64 = 2.523942093541203

Now select the whole drawing and perform the scaling using the 'Scale Factor' calculated above. The distances will be scaled properly and when measured using the measuring tool, it will return the correct expected distance.

Note: For stubborn objects such as 'Rotated Dimensions', the 'Scale Factor' above will not work as expected. A work around is to create a new dimension style and set the 'Scale Factor' to 1/'Scale Factor'. That is 1/2.523942093541203 in the case above.

That is it!

Tuesday, August 15, 2023

My Collection Inkscape Graphics

 All made with INKSCAPE not Adobe or any other commercial software. My inspirations came from the following YouTube channels on Inkscape tutorial: LogosByNick, SimpleShapes, IronEchoDesign, CreateForFree, SweaterCatDesigns and 2dgameartguru.


Sunday, August 13, 2023

How to resize multiple shapes in Inkscape

 I was preparing a client's map in Inkscape vector graphics software (that was the project requirement since the client doesn't work with GIS software). I converted the shapefile into SVG to allow me manipulate the map in Inkscape. You can do the conversion using the GIS tool or use online tools like Aspose or Mapshaper.


So, I stumbled on a huddle where I needed to resize over 2000 points (cycle objects) as seen above.

Now how to I individually select and resize over 2000 objects? Luckily inkscape has this Transform >> Scale tool that could be applied to each individual object.

You can access this tool using "Ctrl + Shift + M" or go to menu "Object >> Transform" as seen below.


On the Scale table set the size you want and check "Apply to each object separately".


That is it!

Saturday, August 5, 2023

PyQGIS - Export features based on selection from another layer

 We have states layer we want to use for selecting and exporting features from other layers that are within a selected state from the states' layer.

To achieve this task, we need to have basic understanding of the following:-

  1. Working with os and pyqgis module
  2. Read all layers listed on the layer's panel
  3. Understand how to get path to layer
  4. Make selection on layer
  5. Export selected features to new shapefile

Lets talk about each of the above separately.


Understanding how to work with OS and PyQGIS modules

One of the commonly used modules in python is the Operating System (OS) module. It provides functions for interacting with the operating system. Specifically in this task we will use the os module to get the base name of a shapefile from a given path.

Let say the shapefile path is this:

"C:\Users\`HYJ7\Desktop\NG_Admin.shp"

Then this will return its base name as 'NG_Admin.shp'

import os
os.path.basename(r"C:\Users\`HYJ7\Desktop\NG_Admin.shp")

Check the "dir(os)", you will see that we can do a lot more than the above including the following;-

'DirEntry', 'F_OK', 'GenericAlias', 'Mapping', 'MutableMapping', 'O_APPEND', 'O_BINARY', 'O_CREAT', 'O_EXCL', 'O_NOINHERIT', 'O_RANDOM', 'O_RDONLY', 'O_RDWR', 'O_SEQUENTIAL', 'O_SHORT_LIVED', 'O_TEMPORARY', 'O_TEXT', 'O_TRUNC', 'O_WRONLY', 'P_DETACH', 'P_NOWAIT', 'P_NOWAITO', 'P_OVERLAY', 'P_WAIT', 'PathLike', 'R_OK', 'SEEK_CUR', 'SEEK_END', 'SEEK_SET', 'TMP_MAX', 'W_OK', 'X_OK', '_AddedDllDirectory', '_Environ', '__all__', '__builtins__', '__cached__', '__doc__', '__file__', '__loader__', '__name__', '__package__', '__spec__', '_check_methods', '_execvpe', '_exists', '_exit', '_fspath', '_get_exports_list', '_walk', '_wrap_close', 'abc', 'abort', 'access', 'add_dll_directory', 'altsep', 'chdir', 'chmod', 'close', 'closerange', 'cpu_count', 'curdir', 'defpath', 'device_encoding', 'devnull', 'dup', 'dup2', 'environ', 'error', 'execl', 'execle', 'execlp', 'execlpe', 'execv', 'execve', 'execvp', 'execvpe', 'extsep', 'fdopen', 'fsdecode', 'fsencode', 'fspath', 'fstat', 'fsync', 'ftruncate', 'get_exec_path', 'get_handle_inheritable', 'get_inheritable', 'get_terminal_size', 'getcwd', 'getcwdb', 'getenv', 'getlogin', 'getpid', 'getppid', 'isatty', 'kill', 'linesep', 'link', 'listdir', 'lseek', 'lstat', 'makedirs', 'mkdir', 'name', 'open', 'pardir', 'path', 'pathsep', 'pipe', 'popen', 'putenv', 'read', 'readlink', 'remove', 'removedirs', 'rename', 'renames', 'replace', 'rmdir', 'scandir', 'sep', 'set_handle_inheritable', 'set_inheritable', 'spawnl', 'spawnle', 'spawnv', 'spawnve', 'st', 'startfile', 'stat', 'stat_result', 'statvfs_result', 'strerror', 'supports_bytes_environ', 'supports_dir_fd', 'supports_effective_ids', 'supports_fd', 'supports_follow_symlinks', 'symlink', 'sys', 'system', 'terminal_size', 'times', 'times_result', 'truncate', 'umask', 'uname_result', 'unlink', 'unsetenv', 'urandom', 'utime', 'waitpid', 'waitstatus_to_exitcode', 'walk', 'write'


On the other hand, PyQGIS is the QGIS Python API. It allows users to automate workflow and extend QGIS with the use of Python libraries. Specifically in this task we will use the following PyQGIS functions:-

QgsProject.instance().mapLayers()
QgsProject.instance().mapLayersByName()
.name()
.source()
.selectByExpression()
processing.run()
QgsProcessingFeatureSourceDefinition()
QgsVectorFileWriter.writeAsVectorFormat()
iface.addVectorLayer()


Read all layer listed on the layer panel

To read all layers listed on the layer's panel, use this function QgsProject.instance().mapLayers()

The function returns a dictionary of the layers which you can iterate over to perform further processing.


Get layer path

The .source() method is used to retrieve path to a layer. We need this specifically to export the selection we will make below and also to create file name and path to save the selected features.


Making selection

There are several ways to make selections. However, here we will make use of selectByExpression method and run the native selectbylocation in the processing.run method.


Exporting selected features

The selected features will be exported using the QgsVectorFileWriter.writeAsVectorFormat method.


The final code

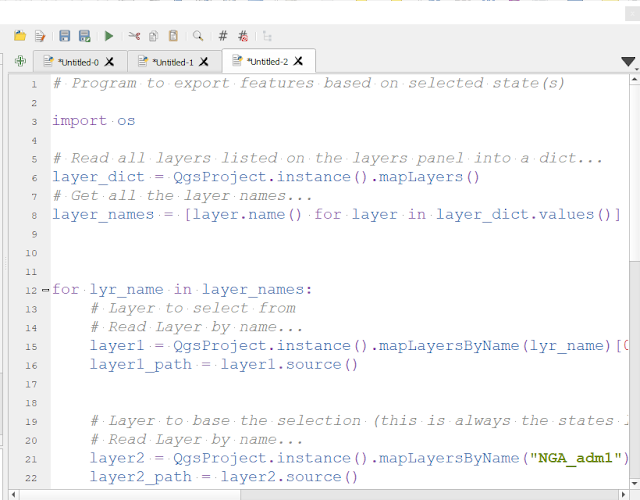
# Program to export features based on selected state(s)

import os

# Read all layers listed on the layers panel into a dict...
layer_dict = QgsProject.instance().mapLayers()
# Get all the layer names...
layer_names = [layer.name() for layer in layer_dict.values()]

for lyr_name in layer_names:
    # Layer to select from
    # Read Layer by name...
    layer1 = QgsProject.instance().mapLayersByName(lyr_name)[0]
    layer1_path = layer1.source()


    # Layer to base the selection (this is always the states layer)
    # Read Layer by name...
    layer2 = QgsProject.instance().mapLayersByName("NGA_adm1")[0]
    layer2_path = layer2.source()

    # Do selectByExpression on layer2...
    state = 'Benue'
    layer2.selectByExpression(f'"state_name" = \'{state}\'')

    # QGIS run processing script....
    processing.run("native:selectbylocation", 
        {'INPUT':layer1_path,
        'PREDICATE':[6],
        'INTERSECT':QgsProcessingFeatureSourceDefinition(layer2_path, selectedFeaturesOnly=True, featureLimit=-1, geometryCheck=QgsFeatureRequest.GeometryAbortOnInvalid),
        'METHOD':0}
        )

    # Make file name...
    fn = state +'__'+ os.path.basename(layer1_path)

    # Save selected features to new shapefile...
    newfile_name = f'C:/Users/`HYJ7/Desktop/Working/Fiverr/2023/07-July/Clip All Layers/SHP/00/{fn}'
    writer = QgsVectorFileWriter.writeAsVectorFormat(layer1, newfile_name, 'utf-8', driverName='ESRI Shapefile', onlySelected=True)

    # To add the newly exported layer to map canvas...
    # iface.addVectorLayer(newfile_name, '', 'ogr')

print('Finished...')


That is it!

Monday, July 24, 2023

Merge excel sheets into a single PDF file

 Here you will find a python code that will merge all excel sheets in a workbook into a single PDF file.

An excel workbook usually contains more than one or more sheets. In this post I want to automate the process of converting several sheets into pdf files then merge those pdf files into one single pdf.


import os
import glob
from PyPDF2 import PdfFileMerger
import win32com.client as client

# ------------------------------------------------
# Convert Excel file to PDF
# ------------------------------------------------
my_xlxs_file = r"C:\Users\`HYJ7\Desktop\XLS to PDF\Sample_quicktransportsolutions.xlsx"

# Open Microsoft Excel in the background
xl_app = client.DispatchEx("Excel.Application")
xl_app.Visible = False
xl_app.DisplayAlerts = False
xl_app.ScreenUpdating = False

pdf_path = os.path.splitext(my_xlxs_file)[0]

# Read Excel File
workbook = xl_app.Workbooks.Open(my_xlxs_file)
sheet_names = [sheet.Name for sheet in workbook.Sheets] # get sheet names

n = 1
for sht in range(len(sheet_names)):
    work_sheet = workbook.Worksheets[sht]

    work_sheet.ExportAsFixedFormat(0, f"{pdf_path}_{n}")
    n += 1

# Close the workbook
workbook.Close()

# ------------------------------------------------
# Merge PDF files into a single file...
# ------------------------------------------------

output_pdf_name = 'TestMergedPDF'
input_dir = r'C:\\Users\\`HYJ7\\Desktop\\XLS to PDF\\'
merge_list = []

for x in os.listdir(input_dir):
    if not x.endswith('.pdf'):
        continue
    merge_list.append(os.path.join(input_dir, x))

merger = PdfFileMerger()

for pdf in merge_list:
    merger.append(pdf)

merger.write(input_dir + f"\\{output_pdf_name}.pdf") #your output directory and pdf_file name
merger.close()

# Delete individual pdf files...
for pdf in merge_list:
    os.remove(pdf)

That is it!

Saturday, July 15, 2023

AutoCAD Programming using AutoLISP

What is LISP

LISP stands for "List Processor". It is a programming language that was developed in the late 1950s by John McCarthy. It is one of the oldest high-level programming languages still in use today. LISP is known for its unique syntax, which is based on nested parentheses and prefix notation.

LISP has found applications in various domains, including artificial intelligence, natural language processing, and symbolic mathematics. It has been used for academic research, commercial software development, and prototyping new programming language concepts. LISP has been influential in the development of other programming languages and has inspired many dialects and variants over the years. Some notable LISP dialects include Common Lisp, Scheme, and Clojure.


What is AutoLISP

AutoLISP is a dialect of the LISP programming language that is specifically designed for extending the capabilities of AutoCAD, a popular computer-aided design (CAD) software. AutoLISP allows users to automate repetitive tasks, create custom commands, and add new functionality to AutoCAD.

AutoLISP is a procedural programming language, which means it follows a step-by-step approach to executing instructions. It provides a set of functions and commands that can be used to interact with AutoCAD's drawing objects, manipulate geometry, modify settings, and perform various operations.

With AutoLISP, you can write scripts and programs that automate tasks such as creating objects, modifying attributes, generating reports, and implementing custom design algorithms. These programs can be executed within the AutoCAD environment, providing users with the ability to tailor AutoCAD to their specific needs and streamline their workflows.

AutoLISP programs are typically written in plain text files with a ".lsp" extension. They can be loaded into AutoCAD using the "Appload" command, which makes the functions and commands defined in the AutoLISP program available for use within the software.

AutoLISP has a rich set of built-in functions for manipulating lists, strings, numbers, and other data types. It also provides control structures such as loops and conditionals to enable decision-making and repetition in your programs. Furthermore, AutoLISP supports the use of variables, user-defined functions, and error handling mechanisms. By leveraging AutoLISP, users can enhance their productivity, automate repetitive tasks, and extend the capabilities of AutoCAD according to their specific requirements.


Structure of AutoLISP Syntax

The syntax of AutoLISP follows the general principles of the LISP programming language but with specific features tailored for use within AutoCAD. Here are some key aspects of AutoLISP syntax:

1. Parentheses: AutoLISP uses parentheses extensively to denote function calls and to structure expressions. Each function call is enclosed in parentheses, with the function name followed by its arguments.

   Example: `(setq x (+ 2 3))`

2. Prefix notation: AutoLISP uses prefix notation, which means the function name precedes its arguments. This differs from traditional infix notation used in many other programming languages.

   Example: `(+ 2 3)` instead of `2 + 3`

3. Lists: AutoLISP treats code and data structures uniformly using lists. A list is enclosed in parentheses and can contain any number of elements, which can be atoms (symbols or numbers) or nested lists.

   Example: `(setq mylist '(1 2 3))`

4. Symbols and variables: Symbols in AutoLISP are used to represent variables, function names, and special operators. They are typically strings of alphanumeric characters and can include special characters like dashes and underscores.

   Example: `(setq radius 5)`

5. Quoting: To prevent the evaluation of expressions, the quote function (') or the backquote syntax (`) is used to quote the following expression. This is useful when you want to treat an expression as data rather than executing it.

   Example: `(setq mylist '(1 2 3))`

6. Functions and special operators: AutoLISP provides a wide range of built-in functions and special operators for performing various operations. Functions are invoked by enclosing the function name and its arguments in parentheses.

   Example: `(setq sum (+ 2 3))`

7. Variables and assignments: Variables in AutoLISP are created using the `setq` function, which stands for "set quote." It assigns a value to a symbol, creating a variable or updating its value.

   Example: `(setq x 10)`

8. Control structures: AutoLISP supports control structures like conditional statements and loops for program flow control. The `if` function is used for conditional branching, while the `repeat` and `while` functions are used for creating loops.

   Example:

   ```

   (if (> x 5)

       (setq result "Greater than 5")

       (setq result "Less than or equal to 5"))

   ```

These are some of the fundamental elements of AutoLISP syntax. Understanding these aspects will help you write AutoLISP programs and extend the capabilities of AutoCAD.

Wednesday, July 5, 2023

Animating SVG maps 101

 Let take a look at how to animate web maps in SVG format. SVG stands for 'Scalable Vector Graphics' and it is a web-friendly vector file format. It defines vector-based graphics in XML format.

Advantages of using SVG over other image formats (like JPEG, PNG and GIF) are:

  • SVG images can be created and edited with any text editor
  • SVG images can be searched, indexed, scripted, and compressed
  • SVG images are scalable
  • SVG images can be printed with high quality at any resolution
  • SVG images are zoomable
  • SVG graphics do NOT lose any quality if they are zoomed or resized
  • SVG is an open standard
  • SVG files are pure XML

SVG images with a drawing program, like Inkscape, Adobe Illustrator etc. Since we will be SVG maps, we can use GIS software like QGIS, ArcGIS etc to create the map then export it to SVG. We can also use online tool like mapshaper to convert GIS map to SVG format.

Whatever method you used in creating you SVG maps is of less importance since all we care in this post is to animate it using CSS.

I will apply the CSS styles right inside the SVG file, so I will surround it with 'Character Data' tag <![CDATA[ ... ]]> to prevent some characters been parsed as part of the SVG XML tags.


1. Change map color on hover and rotate

<style type="text/css" media="screen">
  <![CDATA[

  path {
    cursor: pointer;
    fill: #fff;
    }


  path:hover {
    fill: #ff68ff;

    transition-property: rotate;
    transition-duration: 30s;
    rotate: -90deg;
    }


  ]]>
</style>


2. On hover change map stroke color and stroke width

<style type="text/css" media="screen">
  <![CDATA[

  path {
    cursor: pointer;
    fill: #fff;
    opacity: 1;

    }


  path:hover {
    transition: stroke-width 1s, stroke 1s;

    stroke-width: 8;
    stroke: #000fff;
    }

  ]]>
</style>


Friday, June 30, 2023

Plotting Survey Data in AutoCAD Using Script

 Often you will find yourself trying to plot multiple survey points in AutoCAD. How about if I tell you that you don't have to manually plot each point after the other? You can type a script command with the data points you want to plot into a file and have it plotted on the fly.

Point

Easting

 Northing

P1

331117.87

939830.78

P2

331132.19

939673.41

P3

331144.47

939620.28

P4

331107.64

939601.88

P5

331117.87

939548.75

P6

331173.11

939507.87

P7

331258.45

939526.61

P8

331326.25

939512.55

P9

331438.83

939554.72

P10

331501.51

939534.28

P11

331546.29

939513.83

P12

331630.72

939516.38

P13

331715.15

939521.5

P14

331749.7

939536.83

P15

331766.33

939577.72

P16

331749.7

939665.9

P17

331666.54

939700.4

P18

331557.8

939688.9

P19

331443.94

939678.68

P20

331424.75

939745.13

P21

331391.49

939816.69

P22

331359.51

939883.14

P23

331227.51

939850.09

Plotting using Coordinates

Lets say you got these twenty-three survey points to plot. To use a script to plot the points, you will create a script file with .scr extension (AutoCAD Script (.scr)).

Inside the file, you will type the data like this:-

_POINT 331117.87,939830.78
_POINT 331132.19,939673.41
_POINT 331144.47,939620.28
_POINT 331107.64,939601.88
_POINT 331117.87,939548.75
_POINT 331173.11,939507.87
_POINT 331258.45,939526.61
_POINT 331326.25,939512.55
_POINT 331438.83,939554.72
_POINT 331501.51,939534.28
_POINT 331546.29,939513.83
_POINT 331630.72,939516.38
_POINT 331715.15,939521.50
_POINT 331749.70,939536.83
_POINT 331766.33,939577.72
_POINT 331749.70,939665.90
_POINT 331666.54,939700.40
_POINT 331557.80,939688.90
_POINT 331443.94,939678.68
_POINT 331424.75,939745.13
_POINT 331391.49,939816.69
_POINT 331359.51,939883.14
_POINT 331227.51,939850.09
Run or Load the script file using the SCRIPT command. This will plot all the points starting from the first to the last point.


Make sure you use the PTYPE command to set the point style and size. The end result should look like this image below:-

Friday, June 23, 2023

Mapping GTBank Card Printing Machine Locations

 In this post, I will map the locations of GTBank Card Printing Machine

As at the time of writing, GTBank listed 66 locations where you can self-print ATM card instantly. 

These addresses are note geocoded (that is they don't have latitude and longitude coordinates). For GIS mapping purpose, we need the latitude and longitude coordinates.

Lets see if the trending AI tool "ChatGPT" can help complete this geocoding process. Unfortunately, ChatGPT doesn't give me direct result instead it gave hint on where to get the results.


Make use of the hints provided by ChatGPT, I was able to generate the  latitude and longitude coordinates of GTBank card printing machine locations for mapping purpose as seen below.


Thanks for reading.