Saturday, July 31, 2021

Convert bearings in "Decimal Degree" to "Degree Minute Second" in QGIS

  Here I got attribute column of bearings for some lines in "Decimal Degree" and I want to convert them to "Degree Minute Second" with each unit in a separate attribute column.


The conversion factor is as follow:-

  • 1° = 60'
  • 1' = 60"
  • 1° = 3600"

Note that the bearings where generated using the azimuth expression listed below:-

degrees( azimuth( start_point($geometry), end_point($geometry) ) )


The conversion

As an example, lets convert this 104.580420 (which is in Decimal Degree) to Degree Minute Second.

  • Degree = INT(104.580420) = 104°
  • Minute = INT((104.580420 - 104) * 60) = 34'
  • Seconds = (34.82520000000022 - 34) * 60 = 49.512"

Therefore, the result of 104.580420 is: 104° 34' 49.512"


brg = 104.580420

try:
    # Making sure the brg is a float number...
    brg = float(brg)
    
    # Degree...
    brg_degree = int(brg)

    # Minute
    brg_minute = int((brg - brg_degree) * 60)

    # Second
    brg_second = round( (((brg - brg_degree) * 60) - brg_minute) * 60, 2)

    # Display or return the result...
    print(str(brg_degree) +'° '+ str(brg_minute) +"' "+ str(brg_second) +'" ')
    
except ValueError:
    
    print('Error: Invalid Bearing')


The code above can now be added as a function expression in QGIS field calculator to create a new column like this...


from qgis.core import *
from qgis.gui import *

@qgsfunction(args='auto', group='Custom')
def bearing_func(brg, feature, parent):
    try:
        # Making sure the brg is a float number...
        brg = float(brg)
        
        # Degree...
        brg_degree = int(brg)

        # Minute
        brg_minute = int((brg - brg_degree) * 60)

        # Second
        brg_second = round( (((brg - brg_degree) * 60) - brg_minute) * 60, 2)

        # Display or return the result...
        return str(brg_degree) +'° '+ str(brg_minute) +"' "+ str(brg_second) +'"'
        
    except ValueError:
        
        return 'Error: Invalid Bearing'

Note that the output field type is set to 'Text (String)' because of the symbols used in the result.


That is it!

Wednesday, July 28, 2021

Heatmap with python Folium

 To create a heatmap, we need dataset in the form of XYZ. Where X and Y are the usual long/lat locations and Z can be any value/parameter you want the heatmap to represent (in this can our Z is temperature values).

Here I got this dataset as seen below:-


First we have to read the data and prepare it into a format that the folium heatmap plugin wanted.

The expected format is a list of list... that is: [ [x1, y1, z1], [x2, y2, z2], [x3, y3, z3] ... ]. This is easy to prepare with the pandas module.

import pandas as pd

import folium
from folium import plugins
from folium.plugins import HeatMap


# Load the data in df...
heatmap_df = pd.read_excel(r"Folium Heatmap Data.xlsx")
# heatmap_df.head()

# Convert the df individual rows into list 
df_list = heatmap_df.values.tolist()
df_list

Now, that the data is ready we need to plot the heatmap as follow;-

lon, lat = -105.028306, 39.725343

m = folium.Map([lat, lon], zoom_start=10)

HeatMap(df_list, min_opacity=0.1).add_to(folium.FeatureGroup(name='Heat Map').add_to(m))
folium.LayerControl().add_to(m)

display(m)


The example below use random arrays generated from numpy library and the tile basemap is set to 'stamentoner' as seen below.

import numpy as np
import folium
from folium import plugins
from folium.plugins import HeatMap

lon, lat = -86.276, 30.935 
zoom_start = 5


data = (
    np.random.normal(size=(100, 3)) *
    np.array([[1, 1, 1]]) +
    np.array([[48, 5, 1]])
).tolist()


m = folium.Map([48, 5], tiles='stamentoner', zoom_start=6)

HeatMap(data, min_opacity=0.1).add_to(folium.FeatureGroup(name='Heat Map').add_to(m))
folium.LayerControl().add_to(m)

display(m)


That is it!


Reference resources

  • https://github.com/python-visualization/folium
  • https://nbviewer.jupyter.org/github/python-visualization/folium/blob/master/examples/TilesExample.ipynb
  • https://leaflet-extras.github.io/leaflet-providers/preview/
  • https://nbviewer.jupyter.org/github/python-visualization/folium_contrib/tree/master/notebooks/

Friday, July 23, 2021

Parsing XML data in python

 Extensible Markup Language (XML) is one of the data exchange formats. In the post, we will work through using python's 'xml.etree.ElementTree' module to parse its data content.

An XML data can be available in one of the three forms, namely:-

  • XML file
  • XML URL
  • XML String

Depending on how your XML in made available to you, there is slightly different approaches of reading it use the 'xml.etree.ElementTree' module. Lets see how below.

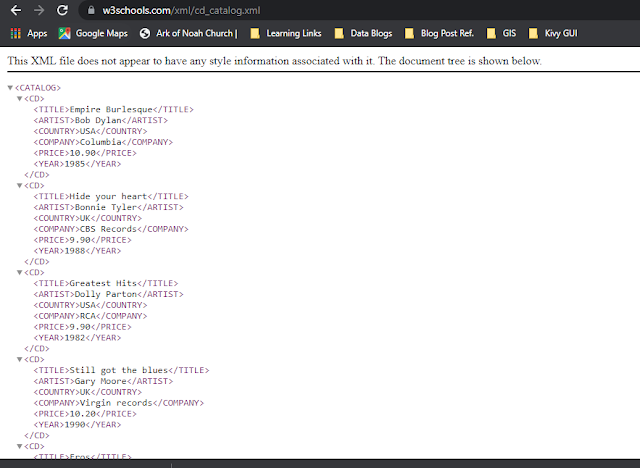
The sample XML I will use is the CD Catalog by W3Schools. I have copied the data into the three formats listed above as seen below;-


# XML file...
xml_file = r"C:\Users\Yusuf_08039508010\Documents\w3s_sample.xml"

# XML URL...
xml_url = 'https://www.w3schools.com/xml/cd_catalog.xml'

# XML String...
xml_string = '''<?xml version="1.0" encoding="UTF-8"?>
<CATALOG>
  <CD>
    <TITLE>Empire Burlesque</TITLE>
    <ARTIST>Bob Dylan</ARTIST>
    <COUNTRY>USA</COUNTRY>
    <COMPANY>Columbia</COMPANY>
    <PRICE>10.90</PRICE>
    <YEAR>1985</YEAR>
  </CD>
  <CD>
    <TITLE>Hide your heart</TITLE>
    <ARTIST>Bonnie Tyler</ARTIST>
    <COUNTRY>UK</COUNTRY>
    <COMPANY>CBS Records</COMPANY>
    <PRICE>9.90</PRICE>
    <YEAR>1988</YEAR>
  </CD>
  <CD>
    <TITLE>Greatest Hits</TITLE>
    <ARTIST>Dolly Parton</ARTIST>
    <COUNTRY>USA</COUNTRY>
    <COMPANY>RCA</COMPANY>
    <PRICE>9.90</PRICE>
    <YEAR>1982</YEAR>
  </CD>
  <CD>
    <TITLE>Still got the blues</TITLE>
    <ARTIST>Gary Moore</ARTIST>
    <COUNTRY>UK</COUNTRY>
    <COMPANY>Virgin records</COMPANY>
    <PRICE>10.20</PRICE>
    <YEAR>1990</YEAR>
  </CD>
  <CD>
    <TITLE>Eros</TITLE>
    <ARTIST>Eros Ramazzotti</ARTIST>
    <COUNTRY>EU</COUNTRY>
    <COMPANY>BMG</COMPANY>
    <PRICE>9.90</PRICE>
    <YEAR>1997</YEAR>
  </CD>
  <CD>
    <TITLE>One night only</TITLE>
    <ARTIST>Bee Gees</ARTIST>
    <COUNTRY>UK</COUNTRY>
    <COMPANY>Polydor</COMPANY>
    <PRICE>10.90</PRICE>
    <YEAR>1998</YEAR>
  </CD>
  <CD>
    <TITLE>Sylvias Mother</TITLE>
    <ARTIST>Dr.Hook</ARTIST>
    <COUNTRY>UK</COUNTRY>
    <COMPANY>CBS</COMPANY>
    <PRICE>8.10</PRICE>
    <YEAR>1973</YEAR>
  </CD>
  <CD>
    <TITLE>Maggie May</TITLE>
    <ARTIST>Rod Stewart</ARTIST>
    <COUNTRY>UK</COUNTRY>
    <COMPANY>Pickwick</COMPANY>
    <PRICE>8.50</PRICE>
    <YEAR>1990</YEAR>
  </CD>
  <CD>
    <TITLE>Romanza</TITLE>
    <ARTIST>Andrea Bocelli</ARTIST>
    <COUNTRY>EU</COUNTRY>
    <COMPANY>Polydor</COMPANY>
    <PRICE>10.80</PRICE>
    <YEAR>1996</YEAR>
  </CD>
  <CD>
    <TITLE>When a man loves a woman</TITLE>
    <ARTIST>Percy Sledge</ARTIST>
    <COUNTRY>USA</COUNTRY>
    <COMPANY>Atlantic</COMPANY>
    <PRICE>8.70</PRICE>
    <YEAR>1987</YEAR>
  </CD>
  <CD>
    <TITLE>Black angel</TITLE>
    <ARTIST>Savage Rose</ARTIST>
    <COUNTRY>EU</COUNTRY>
    <COMPANY>Mega</COMPANY>
    <PRICE>10.90</PRICE>
    <YEAR>1995</YEAR>
  </CD>
  <CD>
    <TITLE>1999 Grammy Nominees</TITLE>
    <ARTIST>Many</ARTIST>
    <COUNTRY>USA</COUNTRY>
    <COMPANY>Grammy</COMPANY>
    <PRICE>10.20</PRICE>
    <YEAR>1999</YEAR>
  </CD>
  <CD>
    <TITLE>For the good times</TITLE>
    <ARTIST>Kenny Rogers</ARTIST>
    <COUNTRY>UK</COUNTRY>
    <COMPANY>Mucik Master</COMPANY>
    <PRICE>8.70</PRICE>
    <YEAR>1995</YEAR>
  </CD>
  <CD>
    <TITLE>Big Willie style</TITLE>
    <ARTIST>Will Smith</ARTIST>
    <COUNTRY>USA</COUNTRY>
    <COMPANY>Columbia</COMPANY>
    <PRICE>9.90</PRICE>
    <YEAR>1997</YEAR>
  </CD>
  <CD>
    <TITLE>Tupelo Honey</TITLE>
    <ARTIST>Van Morrison</ARTIST>
    <COUNTRY>UK</COUNTRY>
    <COMPANY>Polydor</COMPANY>
    <PRICE>8.20</PRICE>
    <YEAR>1971</YEAR>
  </CD>
  <CD>
    <TITLE>Soulsville</TITLE>
    <ARTIST>Jorn Hoel</ARTIST>
    <COUNTRY>Norway</COUNTRY>
    <COMPANY>WEA</COMPANY>
    <PRICE>7.90</PRICE>
    <YEAR>1996</YEAR>
  </CD>
  <CD>
    <TITLE>The very best of</TITLE>
    <ARTIST>Cat Stevens</ARTIST>
    <COUNTRY>UK</COUNTRY>
    <COMPANY>Island</COMPANY>
    <PRICE>8.90</PRICE>
    <YEAR>1990</YEAR>
  </CD>
  <CD>
    <TITLE>Stop</TITLE>
    <ARTIST>Sam Brown</ARTIST>
    <COUNTRY>UK</COUNTRY>
    <COMPANY>A and M</COMPANY>
    <PRICE>8.90</PRICE>
    <YEAR>1988</YEAR>
  </CD>
  <CD>
    <TITLE>Bridge of Spies</TITLE>
    <ARTIST>T'Pau</ARTIST>
    <COUNTRY>UK</COUNTRY>
    <COMPANY>Siren</COMPANY>
    <PRICE>7.90</PRICE>
    <YEAR>1987</YEAR>
  </CD>
  <CD>
    <TITLE>Private Dancer</TITLE>
    <ARTIST>Tina Turner</ARTIST>
    <COUNTRY>UK</COUNTRY>
    <COMPANY>Capitol</COMPANY>
    <PRICE>8.90</PRICE>
    <YEAR>1983</YEAR>
  </CD>
  <CD>
    <TITLE>Midt om natten</TITLE>
    <ARTIST>Kim Larsen</ARTIST>
    <COUNTRY>EU</COUNTRY>
    <COMPANY>Medley</COMPANY>
    <PRICE>7.80</PRICE>
    <YEAR>1983</YEAR>
  </CD>
  <CD>
    <TITLE>Pavarotti Gala Concert</TITLE>
    <ARTIST>Luciano Pavarotti</ARTIST>
    <COUNTRY>UK</COUNTRY>
    <COMPANY>DECCA</COMPANY>
    <PRICE>9.90</PRICE>
    <YEAR>1991</YEAR>
  </CD>
  <CD>
    <TITLE>The dock of the bay</TITLE>
    <ARTIST>Otis Redding</ARTIST>
    <COUNTRY>USA</COUNTRY>
    <COMPANY>Stax Records</COMPANY>
    <PRICE>7.90</PRICE>
    <YEAR>1968</YEAR>
  </CD>
  <CD>
    <TITLE>Picture book</TITLE>
    <ARTIST>Simply Red</ARTIST>
    <COUNTRY>EU</COUNTRY>
    <COMPANY>Elektra</COMPANY>
    <PRICE>7.20</PRICE>
    <YEAR>1985</YEAR>
  </CD>
  <CD>
    <TITLE>Red</TITLE>
    <ARTIST>The Communards</ARTIST>
    <COUNTRY>UK</COUNTRY>
    <COMPANY>London</COMPANY>
    <PRICE>7.80</PRICE>
    <YEAR>1987</YEAR>
  </CD>
  <CD>
    <TITLE>Unchain my heart</TITLE>
    <ARTIST>Joe Cocker</ARTIST>
    <COUNTRY>USA</COUNTRY>
    <COMPANY>EMI</COMPANY>
    <PRICE>8.20</PRICE>
    <YEAR>1987</YEAR>
  </CD>
</CATALOG>
'''

Tuesday, July 20, 2021

Reversing the order (rows and columns) of dataframe in R and Python

 Lets see how to reverse the order of dataframe rows and columns in both R and Python scripting.


Reversing the order of rows and columns in Python

import pandas as pd

# Define the DataFrame...
df = pd.DataFrame({'Col1':['Africa', 'Asia', 'Europe', 'North America', 'South America'], 
                     'Col2':[1000, 3000, 6000, 9000, 12000]})

df


# Reversing the order of ROWS
df[::-1].reset_index(drop=True)

# Or

df.iloc[::-1]


# Reversing the order of COLUMNS
df[df.columns[::-1]]

# Or

df.iloc[:, ::-1]


Reversing the order of  rows and columns in R

# Define the DataFrame...
df <- data.frame('Col1'=c('Africa', 'Asia', 'Europe', 'North America', 'South America'),
                'Col2'=c(1000, 3000, 6000, 9000, 12000))


# Reversing the order of ROWS
rev_dfr <- apply(df, 2, rev)

# Reversing the order of COLUMNS
rev_dfc <- rev(df)


That is it!

Saturday, July 17, 2021

Conditional coloring of pandas dataframe cells

In this post, I will go over some pandas function that allow the styling of datafame table in jupyter notebook.

We will learn to style our dataframe to look beautiful which is useful for presentation and highlighting important cells. Our styled dataframe can be exported to excel (.xlsx) spreadsheet without loosing its style decoration.

Knowledge of HTML/CSS table is highly recommended as most of the properties syntaxes are applicable here.

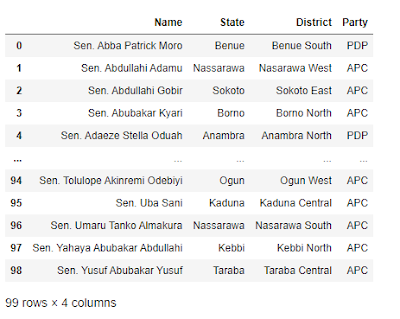
I will make use of the CSV table that contains names of Nigerian Distinguished Senators as seen below. Feel free to make use of your own table of choice, the concept is what matters not the table data per se.
df_table = pd.read_csv(r"C:\Users\Yusuf_08039508010\Desktop\Distinguished Senators.csv")

df_table


Let see how we can change the default table above to our liking...

Styling the entire table using: set_table_styles() function

Using the function "set_table_styles()", we can style the entire table (i.e: header, columns, rows, border etc.) by applying CSS styling tags.

# Template...
# { '...':'...', '...':[(...), (...), (...)] }
# { 'selector':'th/td/tr:nth-of-type(odd/even)', 'props':[('pro1', 'value'), ('pro2', 'value'), ('pro3', 'value')] }


# Styling the entire table...
df_table.style.set_table_styles([
# Style table head...
    {'selector':'th',
    'props':[('background', '#123000'), ('color', 'white'), ('font-size', '15px')]
    },
    
# Style table row/column... border option: solid, dashed, dotted
    { 'selector':'td', 'props':[('border', '2px dotted green'), ('', '')] },
    
    # Style nth odd/even rows....
    { 'selector': 'tr:nth-of-type(odd)', 
     'props':[('background', 'white'), ('border', '2px dashed #D0D0D0')] },

])


The code above output this table styled below...


We can add hover style like so...
... {'selector': 'td:hover',
     'props': [('background-color', 'gray'), ('font-size', '2em')] },
    
    {'selector': 'tr:hover',
     'props': [('background-color', 'yellow')] }, ...


set_properties() function

df_table.style.set_properties(**{
    'background-color':'cyan',
    'color':'brown',
    'border':'2px solid black',
})
The set_properties() function could also be used to style the table as seen.


With set_properties() option, you can export/save the styled dataframe to .xlsx excel file.

Saturday, July 10, 2021

Python web map with Flask/Django and Folium

 By the end of this tutorial, we will build a web app in both Flask and Django that will display at least four maps with different tile styles as seen below.


These map styles are the default styles available in the Folium package. There names are:-
  • OpenStreetMap
  • Stamen Terrain
  • Stamen Watercolor
  • Stamen Toner

You can find more tiles available in leafletjs on this web page address.


Main logic
The primary logic behind this maps is the use of folium package to generate web based leafletjs map like this:-

start_coords = (9.069, 7.472)
folium_map = folium.Map(location=start_coords, 
    zoom_start=13,
    tiles="OpenStreetMap",
    # attr='CartoDB attribution'
    max_zoom=16, 
    min_zoom=10, 
    )

folium_map.save('map.html')


Flask App

After you setup your flask app, the routes that power the maps should look like this:-

@app.route('/map1')
def index_1():
    start_coords = (9.069, 7.472)
    folium_map = folium.Map(location=start_coords, 
        zoom_start=13,
        tiles="OpenStreetMap",
        # attr='CartoDB attribution'
        max_zoom=16, 
        min_zoom=10, 
        )

    folium.Marker(
            location = start_coords,
            popup = '<h1>FATIMAH</h1>',
            tooltip = 'HEHEHE,,,,'
        ).add_to(folium_map)

    return folium_map._repr_html_()


Django Project

In the case of django, our app/views.py and html template will look like below:-

app/views.py

def map1(request):
	start_coords = (9.069, 7.472)
	folium_map = folium.Map(location=start_coords, 
        zoom_start=13,
        tiles="OpenStreetMap",
        # attr='CartoDB attribution'
        max_zoom=16, 
        min_zoom=10, 
        )

	mymap = folium_map._repr_html_() # HTML representation of the map

	context = {
		'map': mymap,
		'map_title': 'Map 1 - OpenStreetMap'
	}

	# return HttpResponse('<h1>This is map page</h1>')
	return render(request, 'map1.html', context)

html template

<div class="container">
    <div>
    	<!-- <p>This the map canvas... </p> -->
    	{{map | safe}}
    </div>


</div>

Note the part {{map | safe}} in the html, that is where the magic takes place. It displays the context folium map variable from the views.py using the safe flag.


Source Code

Download the complete code from the github page.


That is it!

Monday, July 5, 2021

Separating a String column into individual columns/cells

 In this post, I will be separating a 'String' or 'List' column into individual columns/cells.


The problem

I got a table where each cell is a bulky string separated by newline character '\n' as seen below. 


It is required that each separate be on its own cell/column.


The Solution

  • Step 1: Read the table into dataframe
  • Step 2: Convert the string column to 'list' where '\n' serves as the separator
  • Step 3: Convert the list element into independent columns/cells
# Step 1: Read the table into dataframe
df = pd.read_excel('Sep_Str_List.xlsx')

# Step 2: Convert the string column to 'list' where '\n' serves as the separator
# Since the string is separated by '\n', let split on it to convert to list
df['List_Col'] = df['Str_Col'].apply(lambda x: x.split('\n'))

# Step 3: Convert the list element into independent columns/cells
# Separating a 'List' column into individual columns/cells
df_individual_col = df['List_Col'].apply(pd.Series)

# Concatenate df to df_individual_col
df_final = pd.concat([df, df_individual_col], axis=1)
df_final


That is it!

Thursday, July 1, 2021

Mapping Poor And Vulnerable Nigerians by state

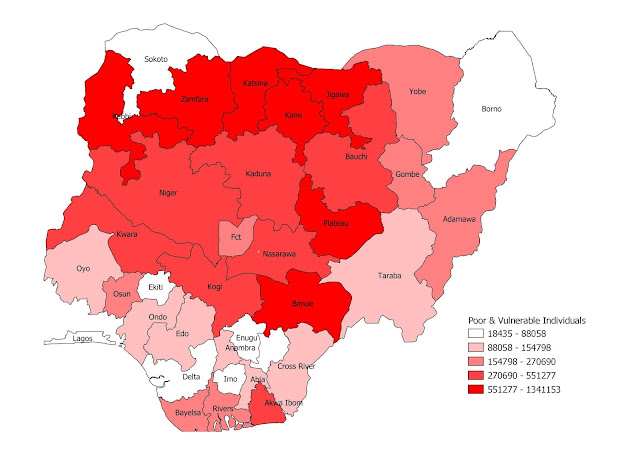
In this post, I will visualize the table below on a map. The types of map we will produce will include Choropleth map, Proportional Symbol map etc.


The table is on Nigeria Poor & Vulnerable Households provided by "The National Social Register of Poor & Vulnerable Households (PVHHs)" as of 31st March, 2020.
Note that some few states (Ebonyi and Ogun states in this case) are missing from the record.

Preparing the Choropleth maps

I will use QGIS software to map this data by following these steps listed below:-
  1. Convert the table above to a CSV file and load it into QGIS
  2. Get Shapefile map of Nigeria states from GADM or Diva-GIS and load it into QGIS
  3. Join the two layers above based on the state name column
  4. Make sure the joined attribute columns (Households and Individuals) are numeric/integer columns. You can use the 'Refactor fields' algorithm to edit the structure of the attributes table.
  5. Next use the fields (Households and Individuals) to symbolize the map using graduated symbols.

Poor & Vulnerable Households


Poor & Vulnerable Individuals


Obviously, for this kind of map, you will edit the key/legend number range to the nearest thousands. I decided to leave the default since this is just for demo purpose.