Tuesday, April 30, 2024

Get Lat/Long from OpenStreetMap ID

 One way to obtain latitude and longitude of an object on OpenStreetMap (OSM) given its node ID is via the OSM API.

In this post, we shall see how to use the OSM API to retrieve latitude and longitude from a given node ID. The API endpoint for doing this is: https://api.openstreetmap.org/api/0.6/node/{osm_id} which be default returns result in XML.

To return result in JSON, you need to append '.json' at the end of the url endpoint like so: https://api.openstreetmap.org/api/0.6/node/{osm_id}.json

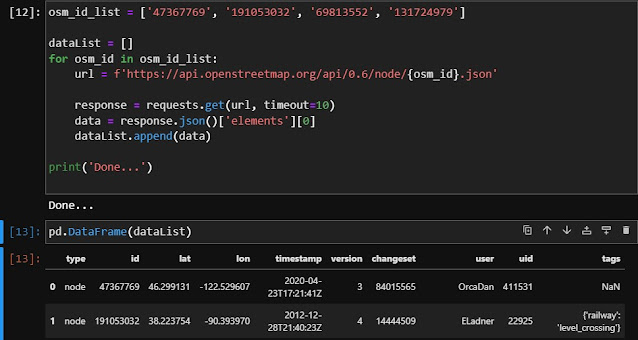
The script below shows how to retrieve latitude, longitude and other details from this ['47367769', '191053032', '69813552', '131724979'] list of OSM IDs.


import requests
import pandas as pd

osm_id_list = ['47367769', '191053032', '69813552', '131724979']

dataList = []
for osm_id in osm_id_list:
    url = f'https://api.openstreetmap.org/api/0.6/node/{osm_id}.json'

    response = requests.get(url, timeout=10)
    data = response.json()['elements'][0]
    dataList.append(data)

print('Done...')


That is it!

Sunday, April 28, 2024

PyQGIS Count Features in Layers

 I was working with hundreds of layers from OSM .pbf files. A .pbf file can contain multiple layers inside it, whenever I load one .pbf file, I get like 4 to 5 layers. By the time I load 50 of .pbf files, you know approximately how many layer I got to work on.

Since, there are much layers to handle manually I had to write script to automate some of my workflows.

1) Get layer path on disc and count number of feature in it

# Get path to layer location on disc...
layers_on_panel = QgsProject.instance().mapLayers()
layer_paths = [l.source() for l in layers_on_panel.values()]

# Count Features in layer...
for lpath in layer_paths:
    if 'power_substation_point' in lpath:
        # Read the vector layer...
        layer = QgsVectorLayer(lpath, '', 'ogr')
        # Count the features...
        print( layer.featureCount() )


2) Load .pbf layer to 'layer panel' from path

## Load layer from path...
for lpath in layer_paths: # Note that 'layer_paths' is from above...
    if 'water_pipeline' in lpath:
        pbf_file_name = lpath.split('\\')[-1].split('.')[0]
        
        # Construct file name...
        fn1 = lpath.split('\\')[-1].split('.')[0]
        fn2 = lpath.split('\\')[-1].split('.')[-1].split('=')[-1]
        display_name = fn1 +'__'+ fn2
        
        # Read vector file and add it layer panel...
        layer = QgsVectorLayer(lpath, display_name, 'ogr')
        QgsProject.instance().addMapLayer(layer)
        
print('\nDone...')


3) Write layer paths to text file

with open('test.txt', 'w') as f:
    for a in layer_paths: # note 'layer_paths' is from above...
        e = str(a) + '\n'
        f.write(e)
        
print('Done...')


That is it!

Saturday, April 6, 2024

Legal news scrapping

 The code snippet below helps in scrapping data from the legal news website.

Some steps require manual interaction, so the snippet is separated into notebook cells. The # ******** indicates beginning and end of a cell.

url = 'https://www.legalnews.com/Home/Login'
pw = ''
un = ''

path = r"chromedriver.exe"

service = Service(executable_path=path)
driver = webdriver.Chrome(service=service)

driver.get(url)
time.sleep(2)

# Login...
driver.find_element(By.XPATH, '//*[@id="email"]').send_keys(un)
driver.find_element(By.XPATH, '//*[@id="password"]').send_keys(pw)
driver.find_element(By.XPATH, '//*[@id="btnlogin"]').click()

time.sleep(3)
driver.find_element(By.XPATH, '//*[@id="top-right"]/div/a[1]').click()
# **********************************************
# -------------------
# Do some manual click to change the table view to table... then run the next cell
# -------------------
# **********************************************

dfList = []
# **********************************************


html_data = driver.page_source
soup = BeautifulSoup(html_data, 'html.parser')

# Read table to df...
tb = pd.read_html(html_data)

# Extract URL of rows...
prod_title = soup.find_all('tr') # ['data-href']

noticeURL_list = []
for t in prod_title:
    try:
        noticeURL_list.append(f"https://www.legalnews.com{t['data-href']}")
    except Exception:
        pass
    
tb[1]['URL'] = noticeURL_list

# Make df a farmiliar dataframe... :)
df = tb[1]

dfList.append(df)
# **********************************************


# Click 'Next Page' btn...  *** CLICK ON PAGE 2 MANUALLY TO AVOID ERROR ***
i = 2
p = 2
for x in range(10):
    print(f'Clicking on page... {i}')
    
    driver.find_element(By.XPATH, f'//*[@id="divListView"]/div[1]/div[1]/a[{p}]').click()
    time.sleep(2)

    html_data = driver.page_source
    soup = BeautifulSoup(html_data, 'html.parser')

    # Read table to df...
    tb = pd.read_html(html_data)

    # Extract URL of rows...
    prod_title = soup.find_all('tr') # ['data-href']

    noticeURL_list = []
    for t in prod_title:
        try:
            noticeURL_list.append(f"https://www.legalnews.com{t['data-href']}")
        except Exception:
            pass

    tb[1]['URL'] = noticeURL_list

    # Make df a farmiliar dataframe... :)
    df = tb[1]
    dfList.append(df)
    i = i+1
    
print('Done...')

# **********************************************

df2 = pd.concat(dfList).drop_duplicates()
df2.to_excel(f'LegalNews__April2024_Table1.xlsx', index=False)
df2


That is it!

Wednesday, April 3, 2024

Downloading US Census Tracts

 According to Wikipedia, A census tract aka census area or census district or meshblock is a geographic region defined for the purpose of taking a census. Sometimes these coincide with the limits of cities, towns or other administrative areas and several tracts commonly exist within a county. 

The US Census Tracts can be downloaded from the United States Census Bureau. It is provided in TIGER/Line format. TIGER stands for "Topologically Integrated Geographic Encoding and Referencing", or TIGER, or TIGER/Line is a format used by the United States Census Bureau to describe land attributes such as roads, buildings, rivers, and lakes, as well as areas such as census tracts.


The state of Alabama will look like this:-


This map layer can then be joined with any tabular record for further analysis.