Friday, November 26, 2021

Several ways of doing same thing in programming - mapping two lists into one dictionary

 In programming there is always more than one way to solve the same problem. This variations depends on individual skills and way of thinking.

In this article I will demonstrate different ways to solve the same problem using python scripting.


The problem:

Python program to map two lists into a dictionary.

countries = ['Nigeria', 'Germany', 'Italy', 'USA', 'Japan', 'Ghana']
score = [39, 23, 12, 67, 45, 11]


The Solution:

1) Using zip() function

# Using zip() function
countries = ['Nigeria', 'Germany', 'Italy', 'USA', 'Japan', 'Ghana']
score = [39, 23, 12, 67, 45, 11]

data = dict(zip(countries, score))
print(data)


2) Using Dictionary Comprehension

# Using Dictionary Comprehension
countries = ['Nigeria', 'Germany', 'Italy', 'USA', 'Japan', 'Ghana']
score = [39, 23, 12, 67, 45, 11]

data  = {key:value for key, value in zip(countries, score)}
print(data)


3) Using For loop

# Using For loop
countries = ['Nigeria', 'Germany', 'Italy', 'USA', 'Japan', 'Ghana']
score = [39, 23, 12, 67, 45, 11]

countries_score = zip(countries, score)

data_dict = {}

for key, value in countries_score:
    if key in data_dict:
        # handling duplicate keys
        pass 
    else:
        data_dict[key] = value
        
print(data_dict)


4) Using For and Range

# Using For and Range
countries = ['Nigeria', 'Germany', 'Italy', 'USA', 'Japan', 'Ghana']
score = [39, 23, 12, 67, 45, 11]

data = {countries[i]: score[i] for i in range(len(countries))}
print(data)


All the four solutions above will give same output result as seen below:-

{'Nigeria': 39, 'Germany': 23, 'Italy': 12, 'USA': 67, 'Japan': 45, 'Ghana': 11}


That is it!

Tuesday, November 16, 2021

Making contour map using QuickGrid Software

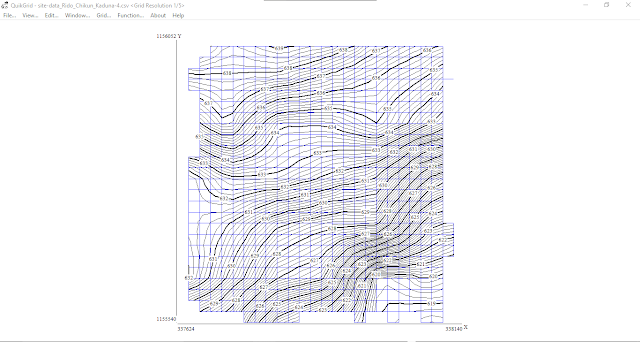
 QuickGrid is a free software for making contour maps or 3D mesh using XYZ dataset. It is a good free alternative to Surfer.

Download and in the QuickGrid lets see how quick it is to generate a contour map.


First we have to prepare our dataset like this:-


The first column is X (Easting or Longitude), second column is Y (Northing or Latitude) and the last column is Z (Height or Altitude). Note that there is not column name for the data and is saved as a .CSV file.

To load in the dataset, go to: File >> Input scattered data points >> Input metric data points


This will display a gridded contour map immediately as seen above.

Now we can style the contour interval and labels like this:-


If you want to use the contour in AutoCAD, set the output option to use polyline for DXF output.


Then you can export to AutoCAD from the 'File' menu.


There is a lot more you can do with QuickGrid, however this is a good start for you to explore more on the software.


Thank you for following.

Wednesday, November 10, 2021

Overlay old image map on leafletjs web map

 In this post, I will show how to overlay an image map on the  leafletjs web map interface.

The image map is a seen below:-


We need to get the coordinates of the opposite corners in this format "[[y1, x1], [y2, x2]]".


To overlay rhe image, the code is thus:-

<!DOCTYPE html>
<html>
<head>
	
	<title>Leaflet Map...</title>

	<meta charset="utf-8" />
	<meta name="viewport" content="width=device-width, initial-scale=1.0">
	
    <link rel="stylesheet" href="https://unpkg.com/leaflet@1.7.1/dist/leaflet.css" integrity="sha512-xodZBNTC5n17Xt2atTPuE1HxjVMSvLVW9ocqUKLsCC5CXdbqCmblAshOMAS6/keqq/sMZMZ19scR4PsZChSR7A==" crossorigin=""/>

    <script src="https://unpkg.com/leaflet@1.7.1/dist/leaflet.js" integrity="sha512-XQoYMqMTK8LvdxXYG3nZ448hOEQiglfqkJs1NOQV44cWnUrBc8PkAOcXy20w0vlaXaVUearIOBhiXZ5V3ynxwA==" crossorigin=""></script>

    <!-- JQuery -->
    <script src="https://ajax.googleapis.com/ajax/libs/jquery/3.5.1/jquery.min.js"></script>    


<style type="text/css">

	#slider{
		position: fixed;
		z-index: 900;
		border: 2px solid gray;
		top: 100px;
		left: 20px;
	}
</style>
	
</head>
<body>


<div id="slider">
	<h4>Image Opacity: <span id="image-opacity">0.5<span/>  </h4>
	<input type='range' id='sldOpacity' min='0' max="1" step='0.1' value='0.5' >
</div>


<div id="mapid" style="width: 100%; height: 600px;"></div>


<script>
	// Create the map obj...
	var mymap = L.map('mapid', {minZoom: 2, maxZoom: 20})
				 .setView([8.54090, 7.71428], 13);


	// Set a default base map to...
    L.tileLayer('http://{s}.google.com/vt/lyrs=m&x={x}&y={y}&z={z}',{
        // minZoom: 0,
     	maxZoom: 18,
        subdomains:['mt0','mt1','mt2','mt3']
    }).addTo(mymap);


  	var imageUrl = "Group_Assignment.jpg",
  	imageBounds = [ [8.58061, 7.68495], [8.50206, 7.75181] ];
	var Old_Imge = L.imageOverlay(imageUrl, imageBounds, {
		opacity:0.4,
	}).addTo(mymap);

	Old_Imge.bringToFront();


var overlayMaps = {
    'Old Image' : Old_Imge
};


var baseLayers = {
	// Basemaps go here...
};

// Adding baseMaps and overlayMaps
L.control.layers(baseLayers, overlayMaps, {collapsed: false}).addTo(mymap);


$(document).ready(function(){
	  // jQuery methods go here...

	  $('#sldOpacity').on('change', function () {
	  		$('#image-opacity').html(this.value);

	  		Old_Imge.setOpacity(this.value);
	  });


}); // end Jquery doc ready.


</script>


</body>
</html>

Note that the code above include adding the image to layer control and a slider to give some controls on the overlaid image. See live demo below:-


Live Demo


That is it!

Thursday, November 4, 2021

Python GIS data wrangling - Mapping supper eagles head coaches since 1949

 The Nigerian senior national football team (super eagle) has had several coaches from 1949 till date. Lets prepare a data I found online about these coaches for use in any GIS platform.

The dataset for this exercise was collected from this hash tag: #Born2RichSports #Deliveringthebestinsports.

We will use python to wrangle this data into a GIS friendly format. Lets get started...

See all Super Eagles coach list from 1949 till date
------------------------------------
England: Jack Finch (1949)
Nigeria: Daniel Anyiam (1954–1956)
England: Les Courtier (1956–1960)
Israel: Moshe “Jerry” Beit haLevi (1960–1961)
Hungary: George Vardar (1961–1963)
England: Joey Blackwell (1963–1964)
Nigeria: Daniel Anyiam (1964–1965)
Hungary: József Ember (1965–1968)
Spain: Sabino Barinaga (1968–1969)
Nigeria: Peter ‘Eto’ Amaechina (1969–1970)
West Germany: Karl-Heinz Marotzke (1970–1971)
Brazil: Jorge Penna (1972–1973)
West Germany: Karl-Heinz Marotzke (1974)
Socialist Federal Republic of Yugoslavia: Tihomir Jelisavčić (1974–1978)
Brazil: Otto Glória (1979–1982)
West Germany: Gottlieb Göller (1981)
Nigeria: Festus Onigbinde (1983–1984)
Nigeria: Chris Udemezue (1984–1986)
Nigeria: Patrick Ekeji (1985)
Nigeria: Paul Hamilton (1987–1989)
West Germany: Manfred Höner (fr) (1988–1989)
Netherlands: Clemens Westerhof (1989–1994) as Technical Adviser
Nigeria: Shaibu Amodu (1994–1995)
Netherlands: Jo Bonfrere (1995–1996)
Nigeria: Shaibu Amodu (1996–1997)
France: Philippe Troussier (1997)
Nigeria: Monday Sinclair (1997–1998)
Federal Republic of Yugoslavia: Bora Milutinović (1998)
Netherlands: Thijs Libregts (1999)
Netherlands: Jo Bonfrere (1999–2001)
Nigeria: Shaibu Amodu (2001–2002)
Nigeria: Festus Onigbinde (2002)
Nigeria: Christian Chukwu (2002–2005)
Nigeria: Augustine Eguavoen (2005–2007)
Germany: Berti Vogts (2007–2008)
Nigeria: James Peters (2008)
Nigeria: Shaibu Amodu (2008–2010)
Sweden: Lars Lagerbäck (2010)
Nigeria: Augustine Eguavoen (2010)
Nigeria: Samson Siasia (2010–2011)
Nigeria: Stephen Keshi (2011–2014)
Nigeria: Shaibu Amodu (2014)
Nigeria: Stephen Keshi (2014)
Nigeria: Daniel Amokachi (2014–2015)
Nigeria: Stephen Keshi (2015)
Nigeria: Sunday Oliseh (2015-2016)
Germany: Gernot Rohr (2016–present)

#Born2RichSports #Deliveringthebestinsports
COPIED

Each row consist of the coach's country, coach's name and the year/period he severed. We need to separate each detail into its own column (that is three columns in this case).

There are several ways to prepare this data, here I saved the text above in a text file to read it into python object like this...


Then read each row/line into a list item for pandas dataframe as seen below...

with open(r"C:\Users\Yusuf_08039508010\Desktop\SuperEagle Coaches.txt", encoding='utf-8') as f:
    data = f.read()

coaches_list = data.split('\n')
print(coaches_list)

Now read the list into a dataframe. Next we can split the entries into separate columns for use in a GIS software.

coaches_df = pd.DataFrame(coaches_list, columns=['Coaches'])
coaches_df


coaches_df['Country'] = coaches_df['Coaches'].apply( lambda x: x.split(': ')[0] )
coaches_df['Coach Name'] = coaches_df['Coaches'].apply( lambda x: x.split(': ')[1].split(' (')[0] )
coaches_df['Period'] = coaches_df['Coaches'].apply( lambda x: x.split(': ')[1].split(' (')[1].replace(')', '') )

coaches_df

Now we have a beautiful table like this that we can integrate into GIS for further analysis.


For example, a quick look at the country column we see that the coaches came from 13 unique countries.


That is it!

Wednesday, November 3, 2021

Google base Maps in LeafletJS

 LeafletJS web map supports not just open source basemaps but also other preparatory basemaps such as Google maps and ESRI maps.

In this post, we shall see how to add varying flavors of Google basemaps.


The code below was inspired by this stackoverflow question.

<!DOCTYPE html>
<html>
<head>
	
	<title>Leaflet Map...</title>

	<meta charset="utf-8" />
	<meta name="viewport" content="width=device-width, initial-scale=1.0">
	
	<!-- <link rel="shortcut icon" type="image/x-icon" href="docs/images/favicon.ico" /> -->

    <link rel="stylesheet" href="https://unpkg.com/leaflet@1.7.1/dist/leaflet.css" integrity="sha512-xodZBNTC5n17Xt2atTPuE1HxjVMSvLVW9ocqUKLsCC5CXdbqCmblAshOMAS6/keqq/sMZMZ19scR4PsZChSR7A==" crossorigin=""/>

    <script src="https://unpkg.com/leaflet@1.7.1/dist/leaflet.js" integrity="sha512-XQoYMqMTK8LvdxXYG3nZ448hOEQiglfqkJs1NOQV44cWnUrBc8PkAOcXy20w0vlaXaVUearIOBhiXZ5V3ynxwA==" crossorigin=""></script>

	
</head>
<body>


<div id="mapid" style="width: 100%; height: 600px;"></div>


<script>
	// Create the map obj...
	var mymap = L.map('mapid', {minZoom: 2, maxZoom: 20})
				 .setView([0, 0], 2);


	// Restrict panning to this bounds
	var southWest = L.latLng(-90, -180),
		northEast = L.latLng(90, 180);
	var bounds = L.latLngBounds(southWest, northEast);

	mymap.setMaxBounds(bounds);


	// Set a default base map to...
    L.tileLayer('http://{s}.google.com/vt/lyrs=m&x={x}&y={y}&z={z}',{
        // minZoom: 0,
     	maxZoom: 18,
        subdomains:['mt0','mt1','mt2','mt3']
    }).addTo(mymap);


// CREATE GOOGLE MAP LAYER
	// 1- Streets...
	googleStreets = L.tileLayer('http://{s}.google.com/vt/lyrs=m&x={x}&y={y}&z={z}',{
	    maxZoom: 20,
	    subdomains:['mt0','mt1','mt2','mt3']
	});


	// 2- Hybrid...
	googleHybrid = L.tileLayer('http://{s}.google.com/vt/lyrs=s,h&x={x}&y={y}&z={z}',{
	    maxZoom: 20,
	    subdomains:['mt0','mt1','mt2','mt3']
	});


	// 3- Satellite...
	googleSat = L.tileLayer('http://{s}.google.com/vt/lyrs=s&x={x}&y={y}&z={z}',{
	    maxZoom: 20,
	    subdomains:['mt0','mt1','mt2','mt3']
	});


	// 4- Terrain...
	googleTerrain = L.tileLayer('http://{s}.google.com/vt/lyrs=p&x={x}&y={y}&z={z}',{
	    maxZoom: 20,
	    subdomains:['mt0','mt1','mt2','mt3']
	});


var overlayMaps = {
    // Other layers will go here....
};


var baseLayers = {
	'Google Street Map':googleStreets,
	'Google Hybrid Map':googleHybrid,
	'Google Satellite Map':googleSat,
	'Google Terrain Map':googleTerrain,
};

// Adding baseMaps and overlayMaps
L.control.layers(baseLayers, overlayMaps, {collapsed: false}).addTo(mymap);


</script>


</body>
</html>

That is it!