Sunday, December 25, 2016

Nairaland Christmas Birthday Analyzed and Visualized in Python

Members of nairaland.com forum that celebrates their birthday on Christmas dayHappy Birthday Christmas to this Nairaland forum members

Which member of Nairaland.com forum is celebrating his/her birthdays today? Let's derive some insights from the Birthday dataset.

Friday, December 23, 2016

6 Python web scraping libraries you can't afford to ignore

Hello there,
In this post I will share with you some excellent Python Web Scraping Libraries. For the benefit of the reader who doesn't know what web scrapping is, here is quick introduction.

Web Scraping: is a technique employed to extract large amounts of data from websites whereby the data is extracted and saved to a local file in your computer or to a database in table (spreadsheet) format (source, webharvy.com). Web Scraping is also called Screen Scraping, Web Data Extraction, Web Harvesting etc.

Different programming languages have different techniques for doing web data scrapping. Here I will present to you some web data scrapping tools as used in the Python programming languages.


Wednesday, December 21, 2016

Copying tabular data to Excel/CSV file in Python

I know there are several ways of doing this task. But if you have very large number of tables to be copied into several spreadsheets, then the best approach is to automate the process using a scripting language like python.

One of the best python modules for doing this is called: pandas (an easy-to-use data structures and data analysis tools for the Python programming language)

If you don't already have pandas install, run "pip install pandas" from your command window.


Copying tabular data from PDF, HTML, Words etc to Excel/CSV spreadsheet file


With few lines of python pandas script, you can get this done. Then if you have multiple tables to copy into spreadsheets, you can use loop statement to go over all the tables.

I will give a very simple example here. Lets assume you have web page that contains a table and you want to save that table in an excel/csv file, here is how to go about doing it with python pandas module.

Tuesday, December 13, 2016

QGIS - Labeling a shapefile layer using two or more attributes information

Hello there,
There may be a situation whereby you want to display more than one attribute information or label of the shapefile map canvas you are working on. If this sounds like you, then you are reading the right tutorial.

In this post, I will discussed how to: Label a shapefile layer using two or more attributes information in QGIS.

Labeling a Shapefile Layer Using Multiple Attributes Information

Now, I assumed you already now how to label your shapefile map canvas by using a single attribute's information. This is fairly simple and it is what you will be taught in your first GIS training class.
What you probally don't know is that you can make use of more than on attribute information to label your map features in QGIS. This is made possible by the use of "QGIS label expression" command.
That is what QGIS expression in the label expression is used for.


The shapefile am going to use for this demonstration as seen above, has five (5) columns/fields of attributes which are: FID, State_Name, Area, Capital and Population. Now, lets label the map with as single attribute field then with multiple attribute fields.

Saturday, November 26, 2016

Advantages of GeoDatabase over Shapefile

Both GeoDatabase and Shapefile are excellent storage containers for Geospatial datasets. However, the former (geodatabase) has more robust advantages when handling big spatial data over the later (Shapefile).

Here are some of the reasons why you should move to using geodatabase asap when dealing with very big data:-

~ Allow multiple users management and privileges on big geospatial datasets

~ One-to-Many and Many-to-Many relationship between geodata sets.

~ A shapefile isn’t made of a single file. Shapefiles are quite unhandy when working with many of them very often. Four files at least makes a valid shape file (.shp, .dbf, .shx and .prj).

~ Shapefiles are binary files that can't be edited by hand using any text editor. They most be viewed and edited in a GIS software, that is not the case with Geodatabases (SpatiaLite and GeoJSON). You can edit them by hand (using text editor), rather than using GIS software, if you’re so need to do so.

~ Long attribute fileds/column names like “nig_geodb_majortrunck_RoadNetwork” can't be used as 10 characters at maximum is allowed for field name.

~ The maximum file size for shapefile (.shp / .dbf) is 2GB. With a geodatabase, you are not limited by the file size.

~ There are no much support for table field type. Numeric attributes are stored as characters (integers/floats), causing potential problems with rounding etc.

~ NULL values are interpreted differently between systems


Example to clarify the points above


Go to NaturalEarthData.com and download all vector geographical themes of the world as SHAPEFILE and GeoDataBase.

You will easily see that because the dataset contains over 100+ layer/themes, the GeoDB is easier to hand as it holds all the layers in one single file while the shapefile option has at least three files for each of the 100+ layers to deal with.


Thank you for following the blog post.

Tuesday, November 15, 2016

My Favorite GIS Blogs

Hello,

Today I want to share with you a list of "My Favorite GIS Blogs".

These are the GIS online blogs you should definitely keep your eyes on for getting latest up to date trends in the ever changing Geospatial industry...

These are my personal favorite GIS and related blogs:-


Be free to add anyone you feel is missing from the list in the comment section below.


Thanks for following the post.

Wednesday, November 9, 2016

Python List Comprehension Simplified

Hello,

This is going to be as simple introduction to Python List Comprehension.

A "list comprehension" in python provides a concise way to create lists. Basically, it nests 'expression', 'loops' and 'conditions' within a list on a single line. The basic structure of the python's list comprehension is like this: [*expression*  *for object in loop*  *if condition*] - without the "*" of-course.

Example


Assuming we have a list called "my_list" and we want to get the length of individual elements within the list, a 'for' loop can do it as follow:-


When you run above code it will output the result as: 4 10 2 5 1 2

Now lets use "list comprehension" to achieve the same result as above:-


The result returns a list of the lengths like so: [4, 10, 2, 5, 1, 2]

Note that we didn't add a condition to the list comprehension above. len(item): is the expression value and for item in my_list: is the loop part of the "list comprehension". We will add a condition in a moment.

List comprehension has two quick noticeable advantages over using the "for" loop namely:-
1) the code is shorter in length.
2) the result is in an object list instead of individual numbers as obtained using "for" loop.

To add a condition, we simply add an "if" statement to the end of the "list comprehension" as follow;-
Lets add a condition to display only length of items greater than four: if len(item) > 4. Add that syntax to the end of the "list comprehension".


The result returns a list of the lengths greater than four like so: [10, 5]


For more than one condition
Assuming we have to check for more than one conditions as follow; instead just having the lengths greater than four, we also want to consider the lengths less than four and equal to four. This makes it about three conditions to check as follow:-
Less than four = x
Greater than four = y
Equal to four = z


The syntax will be like this: [*expression* *if elif else condition*  *for object in loop* ]

In a normal forLoop it is like this....
for item in my_list:
    if len(item) < 4:
        print('x')
    elif len(item) > 4:
        print('y')
    else:
        print('z')

In list it will look like this....
print(['x' if len(item) < 4 else 'y' if len(item) > 4 else 'z' for item in my_list])
Note that 'elif' is not used in the list comprehension.


Conclusion


Even though "list comprehension" may sound very nice to use it has a little draw back in the sense that it can easily make your code very difficult to read in the nearest feature.

Imagine a situation where you compressed hundreds lines of code using "list comprehension" into a few lines. It become unreadable or difficult to read when time passes.

So use it with caution.


Thank you for following the blog post.

Saturday, November 5, 2016

Understanding the different concepts of GIS - GISystem, GIScience, and GIService

Difference between GISystem, GIScience and GIService


There are three major conceptual frameworks of the acronym "GIS" and without any doubt, the most common or most talked about is the GISystem - Geospatial/Geographic Information System.

However, GIScience and GIService have recently gained popularity within the geospatial industry. For example, in the academia GIS is often viewed as a GIScience while in the business market places, GIS is often viewed as a GIService. Casual GIS users often viewed it as a tool/system (i.e. GISystem) to support their spatial problem solving - GIS is fundamentally about solving real-world problems.


GISystem, GIScience, and GIService


Over the years, the concept of GIS has experienced continues changes, from Geographical Information System (GISystem) to Geographical Information Science (GIScience), and then the development of Geographical Information Services (GIServices).

Tuesday, November 1, 2016

GeoJSON in Python

Introduction


Few days ago, I wrote a blog post on using QGIS to convert a Shapefile to GeoJSON.

In this post, I will talk about working with GeoJSON object in Python programming language.

Basically we know a GeoJSON is an object contains spatially related datasets. Conventions used by GeoJSON are known to programmers, which include C, C++, Java, Python, Perl, etc.

GeoJSON has the benefit of having implementations in many languages (especially JavaScript), making it suitable for inter-application communication of spatial data.


GeoJSON in Python


There are many python libraries that allow you to load and manipulate JSON/GeoJSON objects within the python programming ecosystem. The common and default library is the JSON which comes by default with any python installation.

All you need to do to use it is to call this line "import json".

Code Demo


Am going to use a GeoJSON file containing polygon features and saved with the name "Polygon_3.geojson" on my local disk for this demonstration.


There are two most important functions in the json library for converting python objects to json/geojson or vise-versa named: dumps() and load() functions.

In this demo, I will just read in the geojson file above into the python development environment using the with open() python command. This will allow us have access to the individual polygon elements within the geojson file as follow:-


.As you can see from above, when you load a GeoJSON file using the JSON library, you get a dictionary that contains an entry features, which contains the list of features.

Each feature in turn consists of a dictionary, which among other things, contains an entry geometry.

The geometry is a dictionary containing the entries type (polygon in this case) and coordinates of the vertices. So you can traverse the GeoJSON file like this:

import json

with open('Polygon_3.geojson') as f:
    data = json.load(f)

for feature in data['features']:
    print (feature['geometry']['type'])
    print (feature['geometry']['coordinates'])


As you can see, the GeoJSON file contains five polygons of different number of vertices and shape as indicated by the amount of pairs of coordinates for each polygon.

That is it.
Thanks for reading.

Tuesday, October 25, 2016

Modern Database Models and Technologies

A data models define how the logical structure of a database is modeled. Data Models are fundamental entities to introduce abstraction in a Database Management Systems
 (DBMS). According to WikiPedia, a database model is a type of data model that determines the logical structure of a database and fundamentally determines in which manner data can be stored, organized, and manipulated. The most popular example of a database model is the relational model, which uses a table-based format.

(Source: WikiPedia)

Thursday, October 20, 2016

Background Maps in QGIS

Hi there,

For any GIS task, you need a Basemap to kick start the GIS project. Basemaps are often presented through different GIServices in the form of: TMS, WMS, WMTS, ESRI ArcGIS Services or simply as XYZ tiles.

QGIS has different tools for adding basemaps.


If you need a background map tiles for your QGIS projects, then the two awesome options I do recommend you checkout are OpenLayer and QuickMapServices.

With any of the above plugins, you can import background basemaps in the form of satellite images, line maps, topographic maps, landsat images or combination of the two (hybrid maps) from any of the service providers listed below into your project:-

1) Google
2) Bing
3) OSM - Open Street Map
4) ESRI - ArcGIS Online
5) eAtlas
6) Yandex
7) NASA
8) CartoDB
9) MapQuest
10) MapBox
11) 2gis
12) MapSurfer
13) Apple Maps

You can find all these under QGIS web menu.


Happy mapping.

Monday, October 17, 2016

The new GUI Interface for PostgreSQL - pgAdmin4

Hello,

The eagerly awaited new version of pgAdmin 4 is finally here with features that are more flexible and reliable than its predecessor (pgAdmin 3).

pgAdmin is the leading graphical Open Source management, development and administration tool for PostgreSQL object relational database management system.

For a very long time pgAdmin has been on version 3 (pgAdminlll). However, just of recent (in October, 2016) it was upgraded to version 4 (pgAdmin4).

This new application (pgAdmin4) is designed for operation on both the desktop and a webserver. It is written in Python using the Flask framework for the backend, and Javascript/jQuery/Backbone for the frontend.

The core functionality of pgAdmin4 remains similar to pgAdmin3, but there are a number of changes made. Read more on Dave's blog.

To learn step-by-step how to install pgAdmin4 and also install PostGIS on it, check this link here.


Saturday, October 15, 2016

Number of rows in an SQLite database with python

Hello there,

In this post, I will demonstrate a common issue of concern when working with an SQLite database in python.

As you already know, SQLite database is powered in python with a default module name: sqlite3. You don't need to install this as it already comes with every python installations since python version 2.5.

To use SQLite database in python there are basically six steps to take as follow:-

Step 1: Import sqlite3 module
Step 2: Connect to a database
Step 3: Create a cursor object
Step 4: Write an SQL query
Step 5: Commit changes
Step 6: Close database connection

Getting to know the number of rows in an SQLite database with python


This could be easily determined by use any SQLite GUI browser like SQLiteStudio, DB Browser, Navicat or SQLite Firefox browser add-on. But there is drawback in using the GUI, as you have to install a tool on your working machine and it the dataset within the database in big, it will take some effort to scroll down the table just to know the number of rows in the table.

If you already working in python, this can easily be done with few lines of code as follow.


As you can see above, my database "flights.db" has 6048 rows in its "airlines" table.

You will need to change step 2 and 4 above to match your database name and table name respectively.


Thanks for reading.

Wednesday, October 12, 2016

Difference Between Spatial Database And Non-Spatial Database

Basically, a database consists of an organized collection of data for one or more uses, typically in digital form.

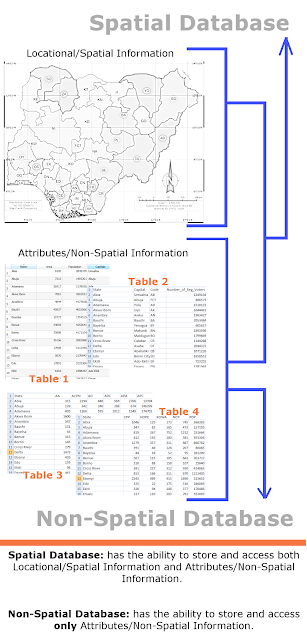
Spatial Database: has the ability to store and access both Location/Spatial Information and Attributes/Non-Spatial Information.

Non-Spatial Database: has the ability to store and access only Attributes/Non-Spatial Information.

The info-graphics below shows the difference in the concepts of Spatial and Non-Spatial databases.


Basically, the differences are in the storage, function, and query capabilities between the two. The notable differences are listed below;-

a)  A spatial database supports special data types for geometric objects and allows you to store geometric data (usually of a geographic nature) in tables while a non-spatial database doesn't support such.

b)  A spatial database provides special functions and indexes for querying and manipulating geospatial data using something like Structured Query Language (SQL) while non-spatial database doesn't provide such functions and indexes.

c)  A spatial database is often used as a storage container for geospatial data, but it can do much more than that. While non-spatial database is often used as a storage container for non-spatial data.

d)  A spatial database uses spatial query in geometric functions to answer questions about space and objects in space. While non-spatial database don't support spatial queries.

e)  In addition to being able to answer questions about the use of space, spatial database functions allow you to create and modify objects in space. This portion of spatial analysis is often referred to as geometric or spatial processing.

f)  A spatially enabled database can intrinsically work with data types like rivers (modeled as linestrings), land parcels (modeled as polygons), and trees (modeled as points). While non-spatial database can’t work with these forms of models.


Examples of Spatial and Non-spatial databases


There are several examples of Spatial and Non-spatial database servers available, but the top common once include:
a) SpatiaLite - SQLite
b) Oracle Spatial/Locator - Oracle
c) MySQL Spatial - MySQL
d) PostGIS - PostgreSQL
e) DB2 Spatial - IBM DB2/Informix
f) MsSQL Spatial - MsSQL server
g) Spatial Hadoop - Hadoop
h) MS Access - this is Non-spatial database, it has no support for Spatial database at the time of writing.

Note that Spatial databases are actually Non-spatial databases with spatial extension added onto them (I hope this makes sense). Anyway, study the pictures below, the first contains Non-spatial databases. After extending them with location/spatial capabilities, they then become Spatial databases.

Before getting location/spatial capabilities


After getting location/spatial capabilities


Thanks for reading.

Monday, October 3, 2016

Working with Spatial Database in QGIS and Python Part 1


Hello,
I will explain how to get up and running with PostGIS Database in QGIS and Python.

This blog post will be in series of three parts. This first part will give an overview and installation steps of PostGIS on the local windows machine. Then Part 2 and Part 3 will discuss on working with the PostGIS database server/engine in QGIS and Python respectively.

Lets get started...


Tuesday, September 27, 2016

Converting Shapefile to GeoJSON


Introduction


If you are like me that often produce web based maps often, you will definitely come across situations were you have to convert the most popular geospatial file format (Shapefile) into the most popular web programming language file format - JSON (thta is: GeoJSON in our case since we care more about location elements).

Before I gone to show how you will convert a shapefile to a GeoJSON, let me briefly explain what a JSON file format is and why it is important to us.


What is JSON?


JSON is a short hand for "JavaScript Object Notation". Though JSON has the name JavaScript it can be used in all different languages since most languages have libraries to parse the JSON data.

JSON is a minimal, readable format for structuring data. It is used primarily to transmit data between a server and web application, as an alternative to XML. It is a lightweight format that is used for data interchanging. It is based on a subset of JavaScript language (the way objects are built in JavaScript). It is a much-more compact way of transmitting sets of data across network connections as compared to XML.

JSON values can consist of: objects (collections of name-value pairs) arrays (ordered lists of values) strings (in double quotes) numbers true, false, or null. JSON is language independent.


What are JSON files?


JSON files are the files which contain JSON data. They are saved with a file extension:  .json

Conventions used by JSON are known to programmers, which include C, C++, Java, Python, Perl, etc. For instance, in Python programming the awareness of the built-in data structures such as Tuple, List, and Dictionary will help you understand JSON/GeoJSON object.


What does it look like?


A simple json structure may look like this:-

"author":
{
"name" : "Umar Yusuf",
"age" : "23",
"gender" : "male",
"url" : "http://www.UmarYusuf.com"
}

Storing JSON: data as a simple example, information about me might be written in JSON as above.

Storing JSON Data in Arrays: a slightly more complicated example involves storing information about two people. To do this, we enclose multiple objects in square brackets, which signifies an array. For instance, if I needed to include information about myself and my brother, it will look like this below:-

[{
"name" : "Umar Yusuf",
"age" : "23",
"gender" : "male"
"url" : "http://www.UmarYusuf.com"
},
{
"name" : "Musa Kallamu",
"age" : "37",
"gender" : "male"
"url" : "http://www.mk.com"
}, ...]


Nesting JSON Data: Another way to store information about multiple people would be to nest objects. To do this, we would create something similar to the following:

{
"Umar":{
"name" : "Umar Yusuf",
"age" : "23",
"gender" : "male"
"url" : "http://www.UmarYusuf.com"
},

"Musa":{
"name" : "Musa Kallamu",
"age" : "37",
"gender" : "male"
"url" : "http://www.mk.com"
}, ...

}


Uses of JSON


~ It is used while writing JavaScript based applications that includes browser extensions and websites.
~ JSON format is used for serializing and transmitting structured data over network connection.
~ It is primarily used to transmit data between a server and web applications.
~ Web services and APIs use JSON format to provide public data.
~ It can be used with modern programming languages.

Saturday, September 24, 2016

Spatial Analysis of Nigeria 2015 Presidential Election Result Using Tableau

Introduction


This is another spatial version of analysis on the "2015 Nigerian Presidential Election Result using python programming language".

Unlike the way we performed the spatial in QGIS with two data sets (Shapefile and CSV files), using Tableau the approach is different.

Spatial and Non-spatial (Attribute) Datasets


With Tableau, you just need to connect to an attribute dataset and the spatial information is generated on the fly as long as it contains some fields/columns identify by Tableau as have geographic role.

The attribute dataset of the 2015 presidential election result from INEC website. Convert is to data source format recognized by Tableau (e.g: csv, excel, database, sql, sas etc). In this case, am converting it to a csv file format.


Friday, September 23, 2016

Spatial Analysis of Nigeria 2015 Presidential Election Result Using QGIS


Introduction


This is the spatial version of analysis on the "2015 Nigerian Presidential Election Result using python programming language".

In this spatial analysis, I will analyze and visualize the “Presidential Election Result” dataset on a map of Nigeria showing individual states boundary. Basically that is what spatial analysis is all about.


Let’s get started…

Friday, September 16, 2016

Research Topics in Surveying and Geo-Informatcs

Hello there,

I often get such question like: How to get project or research topics related to these fields -  land surveying, Surveying and Geo-Informatics, Geomatics Engineering, Geo-spatial Information System (GIS), Remote Sensing, Geodesy etc.

Today, I decided to put up a blog post in an attempt to answer this question often asked by final year students looking for project/research topics related to the fields mentioned above for their final year research project.

I will expose all I know in GIS student project ideas, GIS case studies, GIS projects, and GIS uses to you.

Friday, September 9, 2016

Creating Custom Tableau Maps from existing ShapeFile using QGIS

*** The newer versions of Tableau 10.2 and above supports reading Geospatial files directly. This article is only valid for older versions ***

For those who don't know Tableau and QGIS, here is quick introduction.

Tableau Software is an American computer software company headquartered in Seattle, Washington. It produces a family of interactive data visualization products focused on business intelligence. Tableau can help anyone see and understand their data. Connect to almost any database, drag and drop to create visualizations, and share with a click.


QGIS is a cross-platform free and open-source desktop geographic information system (GIS) application that provides data viewing, editing, and analysis. QGIS is a user friendly Open Source Geographic Information System (GIS) licensed under the GNU General Public License.

Monday, September 5, 2016

Web-based Mapping and Statistics of Nigerian Presidential Election (2015)

Hello,

Today I will use web-based mapping and Statistical techniques to visualize and communicate some important details on the 2015 Nigerian Presidential Election Data.

I will visualize and communicate the following: Number of Accredited Voters Map, Number of Rejected Voters Map, Number of Valid Voters Map, Population Map, and Chart - Population and Accredited Voters all these will be the form of Story Map of 2015 Nigeria Elections. Also the  2015 Elections Population and Accredited Voters chart will be compared with the geographical map.


Result Map and Statistics


Voters Map and Statistics


Analysis of Nigerian Presidential Election Result (2015) using Python Programming Language

Hello,

More than a year after the "Nigerian Presidential Election Result - 2015" was released by Independent National Electoral Commission (INEC - the body that Conducts elections into elective offices in Nigeria), no single analysis of the result was performed and found online in Python Programming Language.

So, I decided to fill this space for the Python programmers. After all, Python is the most widely used Programming Language in the field of Data Science, Big Data and Statistical Analyses. Python is closely chased by R, Matlab, SAS, Julia, Java, and Scala when talking about the best programming languages for crunching data in the field of Data Science (Source).

The Nigerian election is the largest election in West-Africa and largest election among all black nations in the world.

The Presidential Election Result was announced on: Saturday, March 28 to March 29, 2015 by Professor Attahiru Jega the then Chairman of INEC. The result summary and declaration where made available for download on the INEC website.

Sunday, August 28, 2016

Embedding MatPlotLib figure in wxPython GUI

Introduction


wxPython comes with a simple plotting library called PyPlot which is an improvement over wxPlotCanvas, which is now deprecated. PyPlot features include zooming, legends and a grid. Possible graphs: scatter, line, and bar graphs.

So why do we worry to embed matplotlib if wxPython has a plotting by defualt? The simple answer is because of the rich features available in matplotlib library.

I will demostrate a minimal approach to embed MatPlotLib figure into a GUI based on wxPython classic (for Python 2.7.12). This article could also be used for Python 3 on wxPython Phoenix with little modifications. The final result is shown below:-


MatPlotLib figure is a GUI with little controls/widgets, so python programmers often embed the figure into a richer GUI libarary such as wxPython, TkInter, PyQt/PySide etc in order to obtain the most advantage of a GUI application. In this article, am going to use the wxPython GUI libarary.

Wednesday, August 24, 2016

Coordinates Convertion, Downloading Images, and Web mapping with El-shayal GIS software

Hello,

El-shayal is GIS software developed by group of Arabian (Egyptian) developers - Mohamed Elshayal, Salsabeel Mohamed Elshayal and Yaseen Mohamed Elshayal. It is freely available for download at this blog address: www.freesmartgis.blogspot.com

I have been using the two major leading GIS software; ArcGIS in the commercial category and QGIS in non-commercial (open source) category. But there are some GIS tasks that I often referred to El-Shayal GIS software for completion instead of ArcGIS or QGIS simply because El-Shayal GIS software does it easily or even better than ArcGIS and QGIS.

The GIS tasks I am talking about are discussed below, and strongly recommend you to check them out in the El-Shayal GIS software:-

1) Coordinates Convertion
2) Downloading Images from Google Earth
3) Converting Shapefiles into a HTML Website (Web mapping)

I will only compare the above features of El-shayal GIS software to that of QGIS. This is because ArcGIS is already of this contest in that it is not freely available to use and here we are looking at software that deliver full featured GIS tasks at no cost.
I am using the latest versions of both El-shayal GIS software and QGIS at the time of writing. That is: El-shayal GIS software version 16.007d and QGIS version 2.16.0.NØdebo


Let’s get started…

Thursday, August 18, 2016

Data Srapping, Analysis and Visualization with Python

Hello there,

From the title of this post, you should already know that we are about to explore the concepts of Data Science. That is to say: we are going to mung for data, clean the data and try to derive meaningful information from the dataset.

In other for us to be comfortable in carrying out the above task, we need some kind of Hacking skills, Math & statistics knowledge and Substantive expertise in the data we intend to use.

Ok, don't worry am going to keep things simple so everyone can follow along. And the dataset we are going to use is ready available for the public (so no much hacking to get the dataset!).

Dataset and Python libraries


The dataset we are going to use is the "Birthday list" on NairaLand.com home page (i.e: NairaLand Forum Members' Birthday Data). We will attempt to answer some useful questions on the dataset.


Monday, August 15, 2016

How to learn GIS Programming with Python by self-taught

Hello,

Let me guide you on how to learn GIS Programming with python by yourself (self-taught).

Self-taught GIS programmers often use Python, JavaScript, SQL, VB.NET, C++, R, Java, C, HTML, CSS etc… in that order for their day to day GIS workflow (Gisgeography.com). The focus in this article is going to be on Python Programming Language. Python has gained a lot of visibility as the primary scripting language for the big players in GIS industry: ArcGIS and QGIS.

 Gisgeography.com

There are several places you can learn GIS Programming with Python which I broadly classified them into any othe following:-
1) Attending a Formal School (Degree, MSc., PhD.)
2) Certification courses/trainings/workshops
3) One-on-one mentoring
4) Self-taught - read and study Books, Videos, Tutorials

If you are like me, who uses the 4th option, then this article will help you achieve your goal of being a GIS Python Programmer.

So you prefer to self teach yourself GIS Programming? I know so many questions will be ringing in your mind at the moment. Don't worry, I am going to shear with you the best way to master Python for developing geospatial applications. In this post I will try to quickly summarize what is the best way to go in my opinion. It will also show GIS people who are interested in learning more about Python how easy it is to get started, and how useful Python can be to their specific needs.

Sunday, August 14, 2016

Data Science Common Terminologies Defined

Dear Potential Data scientist,
Usually if you are starting out with a new technology, it is good to get familiar with its vocabularies and Data science is not an exception. This will help you in the long run in understand of the new field of learning.

Here are the definitions of some very useful Vocabularies or Word Lists or Glossary in the field of Data Science and its related technologies.

According to WikiPedia: Data science is an interdisciplinary field about processes and systems to extract knowledge or insights from data in various forms, either structured or unstructured, which is a continuation of some of the data analysis fields such as statistics, data mining, and predictive analytics, similar to Knowledge Discovery in Databases (KDD).


Monday, August 8, 2016

GIS Programming with Python and QGIS - Part 2

Hello,
Now that I have introduced you to GIS Programming with Python and QGIS Python Console in part 1 (read part 1 here), lets dive deeper here in part 2.

In this article, am going to run you through some important basics of python GIS programming on the QGIS Python Console. This tutorial will serve as a quick crash course on geoprocessing with Python programming language. It focuses on what Geospatial scientists need. Is also a quick introduction to Python.

Since this tutorial is for the purpose of Geospatial Information System, am going to keep this basic python introduction closely involved with GIS concepts and terminologies. For example to demonstrate the use of print statement the (print() function in python 3), instead of typing {print ‘Hello World’}, I will type {print ‘Hello GIS’}. I hope you got the gist.

The primary difference between conventional programming and this GIS programming we are learning is: "the ability to relate spatial or positional elements (usually in the form of Latitude and Longitude) to GIS programming". So the goal of GIS programming is for you to be able to write script for automating and manipulating a series of spatially related tasks.

This article gives you an overview of what is available in the Python programming universe to help you with GIS programming and integrating with QGIS tools.

Now fire up your QGIS and open the Python Console.

Sunday, August 7, 2016

Analyzing Level Field Table/Book with Python

Hello,

Let me try something new on level survey tabular data apart from the traditional reduction of the reduced levels from the observed Back-sight, Intermediate-sight and Fore-sight.

I know this is never a common task among surveyors. Nevertheless, am going to talk about it today. Am going to perform some unusual statistical analysis on a levelling table using python packages called numpy, pandas and matplotlib.

Levelling is the measurement of geodetic height using an optical levelling instrument and a level staff or rod having a numbered scale.

To determine the difference in level between points on the surface of the ground a 'series' of levels will need to be carried out.

Sunday, July 31, 2016

10+ ways of Running Python Code on the Web browser

10+ online python IDE

There are several ways to run a python script on the desktop. How about on the web browser (local or cloud hosted), how many of such tools do you know?

Today, I present to you 10+ different tools to run a Python Code on your Web browser. They excellent Interactive Python learning platforms.

Lets get started...


How to Install Third-party Python Modules in QGIS (Windows)


-----------------------------------------------------------------------------------------------------
Update: For QGIS 3.x go to this page
-----------------------------------------------------------------------------------------------------


How to Install Third-party Python Modules in QGIS 2.12.3-Lyon (Windows)

If you have installed QGIS, you will see that it bundles its own version of Python in: C:\Program Files\QGIS\apps\Python27. This is the Python that is used when calling python expressions on the QGIS Python Console.

Now we needed to make use of a library called: Python Spatial Analysis Library (PySAL). Then  we entered "import pysal" on the python console but surprisingly, we got an error that the module named pysal doesn't exist. That is TRUE, because it isn't installed with our QGIS python installation! So how do we install this library?

Friday, July 29, 2016

GIS Programming with Python and QGIS - Part 1

Introduction

I will start by introducing the following key words: Programming, Python and QGIS

Programming:
There is high tendency that you as a geospatial professional/graduate/student, you already know what "programming" is all about?
Well, if you don't, here is a brief explanation according to WikiPedia: Computer programming (often shortened to programming) is a process that leads from an original formulation of a computing problem to executable computer programs. The purpose of programming is to find a sequence of instructions that will automate performing a specific task or solving a given problem.

Computer Programming is a much need skill for advanced GIS experts. These days, knowledge and competence in programming is a essential skill set and a critical requirement for most Geospatial job opportunities.  A vast majority of job openings in the Geospatial industry require some expertise in programming, application development and software management.

Some awesome articles I have come across on the web that talked about GIS Programming are listed below (I strongly reccomend you read them);-


Python:
Python is a widely used high-level, general-purpose, interpreted, dynamic programming language. Its design philosophy emphasizes code readability, and its syntax allows programmers to express concepts in fewer lines of code than possible in languages such as C++ or Java (Source WikiPedia).

Of all programming languages, many consider python programming language to be the front-runner in the Geospatial industry. Python has been a standard language in GIS because ESRI (ArcGIS) and open source (QGIS) tend to gravitate toward it. Python is very popular with Geospatial professionals working in the ESRI environment and is considered as the primary scripting language for ArcGIS.

Python provides many opportunities for integration within GIS computing systems. Cross-platform capabilities and ease of integration with other languages (C, C++, FORTRAN, and Java) - (CPython, IronPython, Jython, PyPy) mean that Python is most successful in gluing systems together. Because of the fluid language design, the development of large-scale applications is also easily supported. Many libraries and tools have already been developed for working with GIS data in Python. The basics are covered, including the manipulation of shapefiles, grids, and images, as well as more sophisticated stuff such as scripting pyQGIS API and interaction with Web services and databases.

Python can provide you with a complete set of tools for your GIS toolbox. In combination with QGIS, the possibilities are endless. New technologies, such as Web Map Service (WMS), Web Feature Service (WFS), and Web Coverage Service (WCS) are widely supported in Python. There are many online and paper resources to help you when developing Python scripts.

Other programming languages that are being used in the Geospatial industry includes C, C++, C#, Visual Basic.NET, Flex, Java, ActionScript, JavaScript,PHP, VBA for ArcObjects, etc.


QGIS:
QGIS (previously known as Quantum GIS) is a cross-platform free and open-source desktop geographic information system (GIS) application that provides data viewing, editing, and analysis (Source WikiPedia).

Similar to ArcGIS software, QGIS allows users to create maps with many layers using different map projections. Maps can be assembled in different formats and for different uses. QGIS allows maps to be composed of raster or vector layers.

QGIS integrates with other open-source GIS packages, including PostGIS, GRASS, and MapServer to give users extensive functionality. Plugins written in Python or C++ extend QGIS's capabilities. 

Tuesday, July 26, 2016

50+ technologies and the meaning of there names or acronyms

Every human including you is in one way or the order affected by technology. We often interact with technologies that we don't care about the meaning of there names or acronyms.

Here I present to you some 50+ common 21st century technologies and the meaning of there names or acronyms.

1.) *GOOGLE* - Global Organization Of Oriented Group Language Of Earth.
2.) *YAHOO* - Yet Another Hierarchical Officious Oracle.
3.) *WINDOW* - Wide Interactive Network Development for Office work Solution.
4.) *COMPUTER* - Common Oriented Machine Particularly United and used under Technical and Educational Research.
5.) *VIRUS* - Vital Information Resources Under Siege.
6.) *UMTS* - Universal Mobile Telecommunications System.
7.) *AMOLED* - Active-matrix organic light-emitting diode.
8.) *OLED* - Organic light-emitting diode.
9.) *IMEI* - International Mobile Equipment Identity.
10.) *ESN* - Electronic Serial Number.
11.) *UPS* - Uninterruptible power supply.
12. *HDMI* - High-Definition Multimedia Interface.
13.) *VPN* - Virtual private network.
14.) *APN* - Access Point Name.
15.) *SIM* - Subscriber Identity Module.
16.) *LED* - Light emitting diode.
17.) *DLNA* - Digital Living Network Alliance.
18.) *RAM* - Random access memory.
19.) *ROM* - Read only memory.
20.) *VGA* - Video Graphics Array.
21.) *QVGA* - Quarter Video Graphics Array.
22.) *WVGA* - Wide video graphics array.
23.) *WXGA* - Widescreen Extended Graphics Array.
24.) *USB* - Universal serial Bus.
25.) *WLAN* - Wireless Local Area Network.
26.) *PPI* - Pixels Per Inch.
27.) *LCD* - Liquid Crystal Display.
28.) *HSDPA* - High speed down-link packet access.
29.) *HSUPA* - High-Speed Uplink Packet Access.
30.) *HSPA* - High Speed Packet Access.
31.) *GPRS* - General Packet Radio Service.
32.) *EDGE* - Enhanced Data Rates for Globa Evolution.
33.) *NFC* - Near field communication.
34.) *OTG* - On-the-go.
35.) *S-LCD* - Super Liquid Crystal Display.
36.) *O.S* - Operating system.
37.) *SNS* - Social network service.
38.) *H.S* - HOTSPOT.
39.) *P.O.I* - Point of interest.
40.) *GPS* - Global Positioning System.
41.) *DVD* - Digital Video Disk.
42.) *DTP* - Desk top publishing.
43.) *DNSE* - Digital natural sound engine.
44.) *OVI* - Ohio Video Intranet.
45.) *CDMA* - Code Division Multiple Access.
46.) *WCDMA* - Wide-band Code Division Multiple Access.
47.) *GSM* - Global System for Mobile Communications.
48.) *WI-FI* - Wireless Fidelity.
49.) *DIVX* - Digital internet video access.
50.) *APK* - Authenticated public key.
51.) *J2ME* - Java 2 micro edition.
52.) *SIS* - Installation source.
53.) *DELL* - Digital electronic link library.
54.) *ACER* - Acquisition Collaboration Experimentation Reflection.
55.) *RSS* - Really simple syndication.
56.) *TFT* - Thin film transistor.
57.) *AMR*- Adaptive Multi-Rate.
58.) *MPEG* - moving pictures experts group.
59.) *IVRS* - Interactive Voice Response System.
60.) *HP* - Hewlett Packard.


If you know any that is missing from the above list, kindly add it to the comment below...

Tuesday, July 19, 2016

Creating a Digital clock in Python 3 using TkInter GUI library

Hello there,

Have you been thinking of creating your own digital clock on your windows PC?

Today, I will share with you how to go about it using Python 3 TkInter GUI library

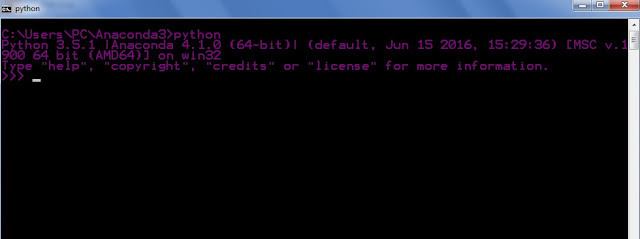
Open your command prompt (cmd), enter python interactive prompt and follow me along


Sunday, July 17, 2016

Coding Python on the Web Browser - Introduction to IPython (Jupyter) notebook

Hello there,

I was once asked by a PHP programmer who was trying to lay his hands on Python Programming language that: whether there is a way to program in Python on the Web (browser)? That is using the Web Browser as the editor? 

Since he was used to PHP development on the browser with the likes of PHP content management systems (Joomla, Drupal, WordPress etc), he will also like to learn or code with Python on the browser.

Here I present to you one of the ways to Program with Python language on the Web browser.

Wednesday, July 13, 2016

Useful Web Links for Tech-Savvy individuals


Hello there,

Today, I present to you some useful and important links for computer savvy individuals to learn any technology such as: IT Training, Programming, Web Development, Networking, Data Sceince, GIS, graphics, animation, freelancing, and more


Photoshop and Graphics


Programing and Other IT Projects

15. www.oswd.org 


I hope it helps.

If you know anyone you want to share, list it in the comment box below.
Thanks