Introduction
This is another spatial version of analysis on the "2015 Nigerian Presidential Election Result using python programming language".
Unlike the way we performed the spatial in QGIS with two data sets (Shapefile and CSV files), using Tableau the approach is different.
Spatial and Non-spatial (Attribute) Datasets
With Tableau, you just need to connect to an attribute dataset and the spatial information is generated on the fly as long as it contains some fields/columns identify by Tableau as have geographic role.

Step for the Analysis
Launch your Tableau desktop (am using the Public version) and connect the INEC csv dataset by selecting "Text file".

Step 2:
The dataset will load into the Tableau environment. Click on "Sheet 1" at the bottom to open a worksheet and start analysis.

Step 3:
Since we have a field called "State", Tableau recognize it as a geographical element, assign geographic role to it and classify it under "Dimensions" pane. Double click on the "State" field to create the map of Nigeria state boundaries.

Change the "Marks" from "Automatic" to "Filled Map" to have a polygon map of the states.

Now at this point, our environment is ready to be explored.
Basic Analysis
Let do some basic explorations on the election dataset. For example, to show the spatial distribution of votes won by the part APC, drag and drop the APC field from the "Measures" pane onto the "Color Wheel" as seen below.

As can be seen, APC won most of its votes in the Northern state.

PDP won partially uniform votes across the states. But it won its higher concentration in the Southern states as seen above.
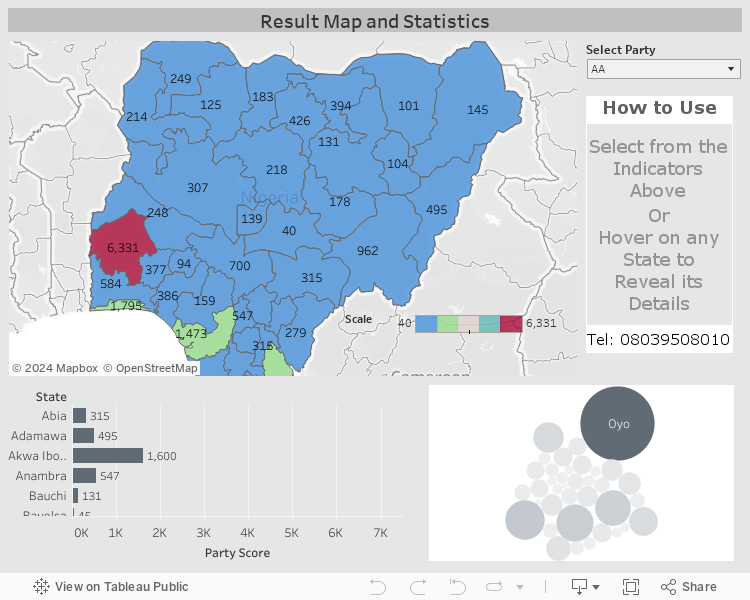
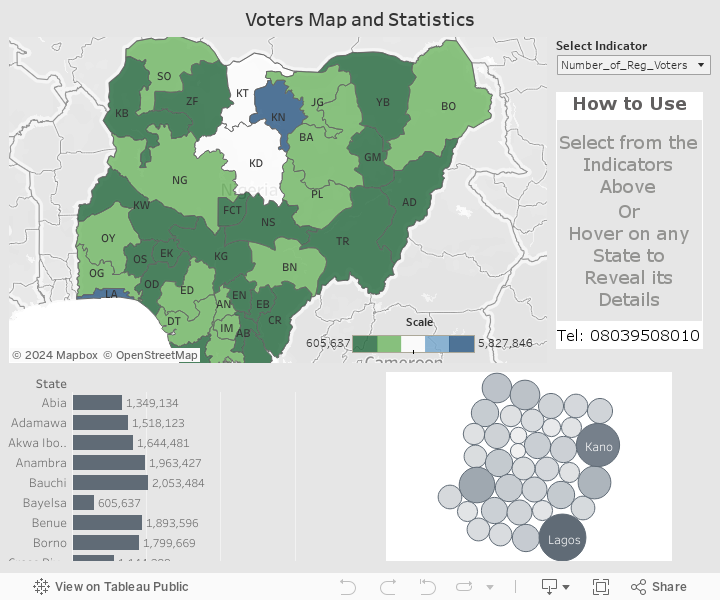
Nigeria Presidential Election Result 2015
Below you will find an interactive map and statistical systems for the 2015 presidential election.
Result Map and Statistics
Voters Map and Statistics
Thank you for reading.
Tremendous work!
ReplyDeleteBeing thinking if folium python module can handle this analysis and still get the same result.