Tuesday, December 11, 2018

How to save High Resolution Image from Google Earth Pro

I have seen many "Google Earth Pro" users taking screenshots of the images instead of saving it directly in high resolution, probably because the "Save Image" function is a little bit obscured. This post will guide you through saving a high resolution image from "Google Earth Pro" released in the year 2018.


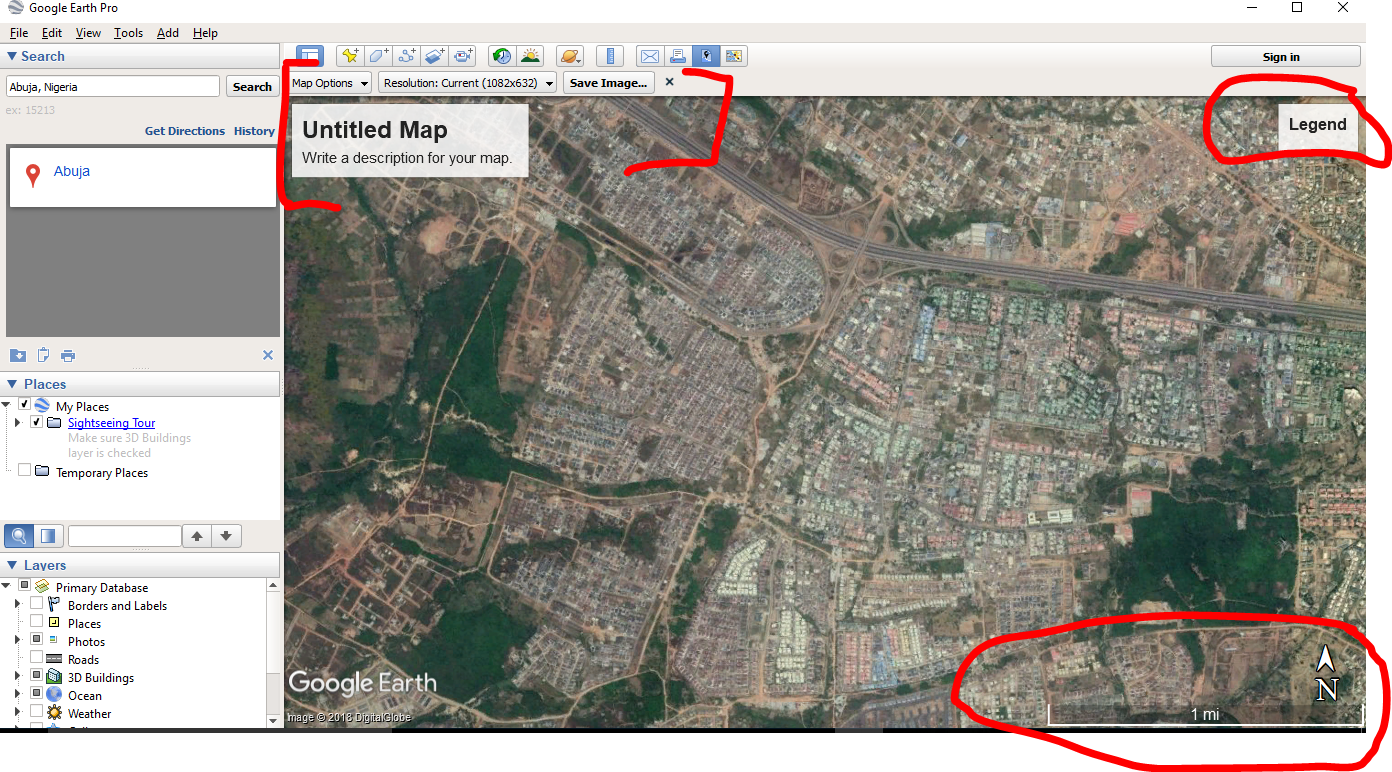
At first when you click on the save button, nothing seems to happen aside the "Untitled Map", "Compass", "Scale" and empty "Legend" boxes that pop-up on the screen.


If you look closely, just under the "Untitled Map" box, there appear the "Save Image" tool bar. On that very tool bar, you will see the "Save Image" button. That is the button you actually needed to save the image.


But before you save your image, you will definitely like to update the map title and do other settings. This can be done from the "Map Options" button on the "Save Image" tool bar.


You could also select your preferred image resolution from the tool bar.

Thank you for reading.

Tuesday, December 4, 2018

An Atlas Map of Nigerian States - QGIS Map Report Tutorial

QGIS 3 comes with a nice feature for creating collection of maps (aka Atlas). This feature is called "Report" in QGIS 3, it works closely like the "Print Layout" (formerly know as "Print Composer" in QGIS 2).

You can access the "Report" window from the project menu as seen below...


In the next few lines, I will demonstrate how to generate a map report in QGIS using the Map of Nigerian States. See the document we want to produce at the end of this tutorial here...


Saturday, December 1, 2018

The Difference between the United Kingdom, Great Britain and England

Often people confuse these three: United Kingdom, Great Britain and England. As an example, in sports different names are used for Olympic games different from football World Cup game and many others.

Below is the map of the world and the area in question is this tiny mass of land within the red mark.


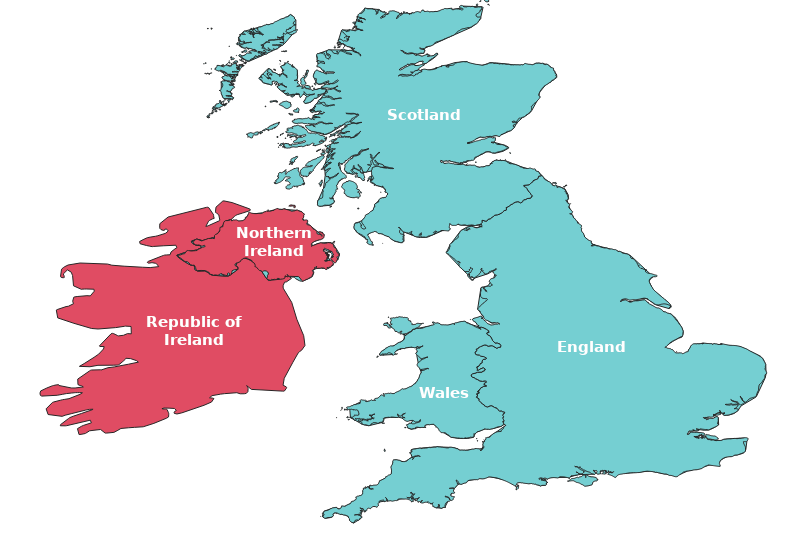
Lets zoom in and look at the map closer, the whole of that area is the "British Isles" consisting of five countries which is categorized into to named: Ireland and Great Britain.

Ireland consist of two countries "Republic of Ireland and Northern Ireland", while Great Britain consist of three countries "England, Scotland and Wales".

United Kingdom is made up off the whole of Great Britain and part of Ireland. That is all the countries in Great Britain ("England, Scotland and Wales") are in United Kingdom and in Ireland only Northern Ireland is part, Republic of Ireland isn't part of United Kingdom.

Hmm! This sounds complicated, right? Let clarify this by visualizing it on a map.


British Isles = Ireland + Great Britain

Here purple color for Ireland and blue color for Great Britain to clearly see to two different regions.


Ireland = "Republic of Ireland + Northern Ireland"
Great Britain = "England + Scotland + Wales"


United Kingdom =  "England + Scotland + Wales + Northern Ireland"


I hope that was clear and succinct.
Thank you for reading

Wednesday, November 14, 2018

Drawing Site Plan with DraftSight a FREE Alternative to AutoCAD

There are many low budget or free Computer-Aided Design (CAD) software alternatives to Autodesk's AutoCAD out there and DraftSight is one of the best alternatives I have used.


Using the free version, you could plot or draw a professional survey plan just as you would do in AutoCAD. In this blog post, I will demonstrate how you will do just that using the free DraftSight CAD software. So, download the DraftSight here and follow the instructions below to activate it.

Instruction 1: Download the software from the link above and launch it to install


Instruction 2: Select Free option and click the next button as seen above.

Instruction 3: Accept the terms in the license agreement and install


Tuesday, November 13, 2018

The difference between "Geocoding" and "Geolocation"

These two terms are often confused by users in of spatial data. Here is a quick explanation to help clarify the difference between the two. Both of these terms are consistently been misuse by people within the geospatial community.

Address: "Abuja International Conference Centre, Herbert Macaulay Way, Abuja, Nigeria"
Coordinates (in 3D): "Latitude: 9.0438014, Longitude: 7.4919024, Sea level: 503m"


Looking at the landmark address above and its corresponding coordinates in three-dimension (3D), we could say:-

Geocoding - means to 'Convert addresses to geographic coordinates, or the reverse'. While  Geolocation - means to 'Return the precise location of a device based on Wi-Fi or cell towers'.

More elaburate explanation from Wikipedia, the free encyclopedia:-

Geocoding is the computational process of transforming a physical address description to a location on the Earth's surface (spatial representation in numerical coordinates). Reverse geocoding, on the other hand, converts geographic coordinates to a description of a location, usually the name of a place or an addressable location. Geocoding relies on a computer representation of address points, the street / road network, together with postal and administrative boundaries.

Geolocation is the identification or estimation of the real-world geographic location of an object, such as a radar source, mobile phone, or Internet-connected computer terminal. In its simplest form geolocation involves the generation of a set of geographic coordinates and is closely related to the use of positioning systems, but its usefulness is enhanced by the use of these coordinates to determine a meaningful location, such as a street address.

Sunday, November 4, 2018

Installed Python Libraries on QGIS Vs Anaconda


As some one who uses Python for Geospatial development, I was tempted to know what modules are installed on QGIS python environment compared to that of Anaconda python.

On the console of the two platforms, I executed this: help('modules') and I got the following out puts.


QGIS:


MetaSearch console mkgraticule sre_parse
PyQt5 contextlib mmap ssl
__future__ copy mmapfile sspi
_ast copyreg mmsystem sspicon
_asyncio crypt mock stat
_bisect csv modulefinder statistics
_blake2 ctypes msilib string
_bootlocale curses msvcrt stringprep
_bz2 cycler multiprocessing struct
_codecs datetime nbformat subprocess
_codecs_cn dateutil netbios sunau
_codecs_hk db_manager netrc symbol
_codecs_iso2022 dbi networkx symtable
_codecs_jp dbm nntplib sys
_codecs_kr dde nose2 sysconfig
_codecs_tw decimal nt tabnanny
_collections decorator ntpath tarfile
_collections_abc difflib ntsecuritycon telnetlib
_compat_pickle dis nturl2path tempfile
_compression distutils numbers textwrap
_csv doctest numpy this
_ctypes dummy_threading odbc threading
_datetime easy_install ogr time
_decimal email ogrmerge timeit
_dummy_thread encodings opcode timer
_elementtree ensurepip operator token
_functools enum optparse tokenize
_hashlib epsg_tr os trace
_heapq errno osgeo traceback
_imp esri2wkt osr tracemalloc
_io exifread owslib traitlets
_json expressions parser tty
_locale faulthandler past turtle
_lsprof filecmp pathlib types
_lzma fileinput pbr typing
_markupbase fnmatch pct2rgb unicodedata
_md5 formatter pdb unittest
_msi fractions perfmon urllib
_multibytecodec ftplib pickle urllib3
_multiprocessing functools pickletools uu
_opcode future pip uuid
_operator gc pipes venv
_osx_support gcps2vec pkg_resources warnings
_overlapped gcps2wld pkgutil wave
_pickle gdal platform weakref
_pydecimal gdal2tiles plistlib webbrowser
_pyio gdal2xyz plotly win2kras
_random gdal_auth poplib win32api
_sha1 gdal_calc posixpath win32clipboard
_sha256 gdal_edit pprint win32com
_sha3 gdal_fillnodata processing win32con
_sha512 gdal_merge profile win32console
_signal gdal_pansharpen pstats win32cred
_sitebuiltins gdal_polygonize psycopg2 win32crypt
_socket gdal_proximity pty win32cryptcon
_sqlite3 gdal_retile py_compile win32event
_sre gdal_sieve pyclbr win32evtlog
_ssl gdalchksum pydoc win32evtlogutil
_stat gdalcompare pydoc_data win32file
_string gdalconst pyexpat win32gui
_strptime gdalident pygments win32gui_struct
_struct gdalimport pylab win32help
_symtable gdalmove pyodbc win32inet
_thread gdalnumeric pyparsing win32inetcon
_threading_local genericpath pyplugin_installer win32job
_tracemalloc getopt pyproj win32lz
_warnings getpass pythoncom win32net
_weakref gettext pytz win32netcon
_weakrefset glob pywin win32pdh
_win32sysloader gnm pywin32_testutil win32pdhquery
_winapi gzip pywintypes win32pdhutil
_winxptheme hashlib qgis win32pipe
abc heapq queue win32print
adodbapi hmac quopri win32process
afxres html random win32profile
aifc http rasutil win32ras
antigravity httplib2 re win32rcparser
argparse idna regcheck win32security
array imaplib regutil win32service
ast imghdr reprlib win32serviceutil
asynchat imp requests win32timezone
asyncio importlib rgb2pct win32trace
asyncore inspect rlcompleter win32traceutil
atexit io runpy win32transaction
audioop ipaddress sched win32ts
base64 ipython_genutils scipy win32ui
bdb isapi secrets win32uiole
binascii itertools select win32verstamp
binhex jinja2 selectors win32wnet
bisect json servicemanager winerror
builtins jsonschema setuptools winioctlcon
bz2 jupyter shapely winnt
cProfile jupyter_core shelve winperf
calendar keyword shlex winreg
certifi lib2to3 shutil winsound
cgi libfuturize signal winxpgui
cgitb libpasteurize simplejson winxptheme
chardet linecache sip wsgiref
chunk locale sipconfig xdrlib
cmath logging sipdistutils xlrd
cmd lzma site xlwt
code macpath six xml
codecs macurl2path smtpd xmlrpc
codeop mailbox smtplib xxsubtype
collections mailcap sndhdr yaml
colorsys markupsafe socket zipapp
commctrl marshal socketserver zipfile
compileall math sqlite3 zipimport
concurrent matplotlib sre_compile zlib
configparser mimetypes sre_constants


Sunday, October 21, 2018

Accessing JSON nested object with python

This blog post highlights the key components to look at when parsing a JSON file with deep level of nested objects and variables.

First thing first, is to load in the file using: with statement...

The nested/child objects can then be accessed like this...
obj1['obj1a']['obj1a_1']['obj1a_2']['obj1a_3']...,
obj2['obj2a']['obj2a_1']['obj2a_2']['obj2a_3']...,
obj3['obj3a']['obj3a_1']['obj3a_2']['obj3a_3']... etc


Take this example, where we have a JSON object with parent object "requests" which contains "0" which also contains "responseCode" which also contains more children (in this case 3 children as seen above). Another child object at the same level with "responseCode" is "testPassFailCounts" which contains 217 more children.

That JSON structure is nested as follow:- requests >> 0 >> responseCode >> ... >> ... >> ... etc. Use a JSON viewer or reader such as JSON Editor Online to visualize the structural arrangement of your specific JSON file.

Now, to access any level of nested child in python follow this code snippet:-

import json

with open('name_of_file.json', encoding='utf-8') as f:
    data = json.load(f)
    
responseCode = data['requests'][0]['responseCode']
testPassFailCounts = data['requests'][0]['testPassFailCounts']

len(responseCode) # will return 3
len(testPassFailCounts) # will return 217


Tuesday, October 16, 2018

TkInter Open select file dialog windows from CMD

Are you writting a script for non tech savvy people that will require them to supply some file path like this: C:\Users\PC Name\Desktop\folder1\folder2\folder3\file-name.csv

As you already guess, many non-tech savvy individuals wont be able to type in such kind of file path to use you script. A work around this is to provide a Graphical User Interface (GUI) to the script, where is easier and user friendly to work with.

Here below is a simple solution using default GUI library that comes with python. This script gets an input file from user interactively via GUI, instead of using the CMD. It is written for both python 2 and 3:-

try:
    # for Python2
    from Tkinter import *   ## notice capitalized T in Tkinter
    from tkFileDialog import askopenfilename

    Tk().withdraw()
    polyfile1 = askopenfilename(title="Select original line file:", filetypes = (("comma-separated value (CSV) files","*.csv"),("all files","*.*"))) # show an "Open" dialog box and return the path to the selected file

    # Using the file...
    print ('Do something with the file in Py2', polyfile1)


except ImportError:
    # for Python3
    from tkinter import *   ## notice lowercase 't' in tkinter here
    from tkinter import filedialog

    Tk().withdraw()
    polyfile1 = filedialog.askopenfilename(title="Select original line file:", filetypes = (("CSV files","*.csv"),("all files","*.*"))) # show an "Open" dialog box and return the path to the selected file

    # Using the file...
    print ('Do something with the file in Py3', polyfile1)


Running the script above should open the select file window as seen below.

That is enjoy the script.

Wednesday, October 10, 2018

How to Upload CSV file of Projected Local Coordinates onto ArcGIS Online

The cloud/web based version of ESRI ArcMap (ArcGIS Online) has come to stay. However, unlike the desktop version (ArcMap) that support many local coordinates systems, ArcGIS Online currently supports geographic coordinates in WGS84 but hardly reads local projected coordinates such as Nigeria Minna Datum UTM Zone 32N, StatePlane coordinates NAD 1983 (e.g StatePlane_Illinois_East epsg: 102671), Hong Kon 1980 Grid System, etc

If you try to upload such CSV file that have projected coordinates on "ArcGIS Online", you will encounter this error that says: "The layer was not created because no locations could be found. Make sure your data has valid location information".


The is because the coordinates in the CSV file are projected in UTM Zone 32 - Minna Datum (used in Nigeria region - EPSG: 26332).

Note: If you getting this required screen error: Location fields not fully specified. Then it means you did not select the correct location fields from the CSV file.


So, be sure to select the correct fields, that is Eastings for Longitude and Northings for Latitude.


If you are getting this error that says: "The layer was not created because no locations could be found. Make sure your data has valid location information", then you have to do one of the following to successfully upload you CSV data file.

Solution 1: Convert the projected coordinates to Geographical coordinates (that is convert from easting & northing to longitude & latitude).

Solution 2: Convert the CSV file itself to GeoJSON. The reason why this GeoJSON work even though the coordinates are still in projected form is because of the attribute or object in the GeoJSON file that defines the correct coordinates system that the coordinates represented.

Wednesday, October 3, 2018

The Basics of Map making With QGIS, GIMP and Inkscape

Making a modern print ready map will require one or both of the following, namely:
1) Scientific analysis
2) Art and design

In other words, the maps you see are both products of scientific charts as well as works of art and design.

GIS software such as QGIS does the science part better, illustration software such as GIMP and Inkscape handles the art part better.

If you are making a map to accurately/precisely visualize some variables based on scale, then you probably need a scientific map done with the QGIS/ArcGIS. If on the other hand, your map is simply to illustrate some variables not accurately/precisely to scale, then an illustration software like GIMP/Adobe Photoshop for raster editing or Inkscape/Adobe Illustrator for vector editing should be enough to get the job done.

With that said, it is a common practice these days to combine both the scientific and art & design software to finish a map layout. That is you will accurately prepare your map to scale in a scientific software and then complete the aesthetic layout using illustration software. Let's take a look at how this can be done below.

QGIS can handle the majority of vector and raster operations and most of the cartographic work. However, from a cartographic perspective, Inkscape and GIMP are primarily used to finish maps created within a GIS. Inkscape handles vector maps, while GIMP is best suited for raster maps. People often use GIMP to fine-tune coloration of a map. Inkscape is often used to add, for example, custom arrows to maps or add shadows to lines and polygons.

Basic Steps for making maps with QGIS, GIMP and Inkscape:-
1) Get the data
2) Load the data into QGIS
3) Symbolise and style the map according to the information the map wants to communicate
4) Prepare and compose it for printing
5) Export it as image for further fine-tuning in GIMP or export is as SVG file for fine-tuning in Inkscape

Note: If you need to have the map in print-ready magazines, brochures, posters, newsletters or other forms of page layouts and typographic quality text and images, then you will need use a desktop publishing application such as Scribus/Microsoft Publisher/Adobe Indesign or Pagemaker.


Conclusion
You should always bear in mind that QGIS understand all the science of map making which includes various GIS, Geodesic and Cartographic processes. GIMP, Inkscape and Scribus are there to support you in archiving a quality print/publish ready info-graphic maps.