According to WikiPedia, a choropleth map is a type of thematic map in which a set of pre-defined areas is colored or patterned in proportion to a statistical variable.
There are many R packages for making and working with maps and GIS/spatial data in general. Some of them are: ggplot2, ggmap, maps, mapdata, tmap, sp, sf, rgdal, rgeos, mapproj, etc. More related packages can be reviewed on this page.
# For reading CSV files
library(readr)
# For reading, writing and working with spatial objects
library(sf)
library(rgdal)
# For creating map
library(tmap)


# Read the CSV data...
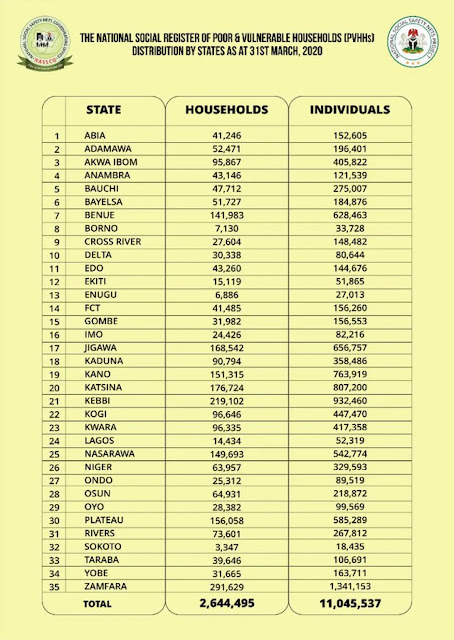
# Note missing data for: Ebonyi and Ogun states
Poor_and_Vulnerable <- read_csv("C:/Users/Yusuf_08039508010/Desktop/Working_Files/Fiverr/2021/08-August/R Poor and Vulnerable/Poor and Vulnerable.csv")

# Read the NIG Admin shapefile... using sf
ng_map1 <- st_read('C:/Users/Yusuf_08039508010/Desktop/Working_Files/Fiverr/2021/08-August/R Poor and Vulnerable/SHP/NIG_ADM.shp')


# Read the NIG Admin shapefile... using rgdal
# ng_map2 <- readOGR("C:/Users/Yusuf_08039508010/Desktop/Working_Files/Fiverr/2021/08-August/R Poor and Vulnerable/SHP", "NIG_ADM")


colnames(ng_map1)

# Quick base R plot...
plot(ng_map1) # by all columns
plot(ng_map1['geographic']) # by column name
plot(ng_map1['geometry']) # by column name


# Simple plot using tmap...
tm_shape(ng_map1) +
tm_polygons(col='geographic')# Installing specific version (0.9.8) of sf package... www.support.rstudio.com/hc/en-us/articles/219949047-Installing-older-versions-of-packages
# Saerch for specific package at: https://cran.r-project.org/src/contrib/Archive/
packageurl <- 'https://cran.r-project.org/src/contrib/Archive/sf/sf_0.9-8.tar.gz'
install.packages(packageurl, repos=NULL, type="source")However, the map we wanted is based on a dataset which is in a CSV file we read into a variable named "Poor_and_Vulnerable". So we have to find a way of combining the CSV data to the map to be able to plot the choropleth map showing the Poor & Vulnerable Households/Individuals in Nigeria.
The process is very simple using the merge() function as follow;-
# Merge the CSV data to the Shp data...

# Check the col names for both the CSV and shp data...
names(Poor_and_Vulnerable)
names(ng_map1)

m <- merge(ng_map1, Poor_and_Vulnerable, by.x='state_name', by.y='State')

names(m)


# Plot choropleth map by Households using tmap...
tm_shape(m) +
  tm_polygons(col='Households')


# Plot choropleth map by Individuals using tmap...
tm_shape(m) +
tm_polygons(col='Individuals')Note that after the merge some states were missing. One reason for this could be because of missing record or mismatch names between the two columns.
Bubble map
A bubble map uses circles of different size to represent a numeric value on a territory. It displays one bubble per geographic coordinate, or one bubble per region (in this case the bubble is usually displayed in the baricentre of the region).
It takes few lines of code to make bubble map using tmap as seen below...
# Bubble Map....
tm_shape(ng_map1) +
  tm_polygons(col='black') +

  tm_shape(m) +
  tm_bubbles("Households", col='red')
If you are interested in traditional GIS graphical approach of producing similar maps, check this post on 'Mapping Poor And Vulnerable Nigerians by state', where I used QGIS to produce similar maps.
Happy mapping!


No comments:
Post a Comment