In this post, I will go over some pandas function that allow the styling of datafame table in jupyter notebook.
We will learn to style our dataframe to look beautiful which is useful for presentation and highlighting important cells. Our styled dataframe can be exported to excel (.xlsx) spreadsheet without loosing its style decoration.
We will learn to style our dataframe to look beautiful which is useful for presentation and highlighting important cells. Our styled dataframe can be exported to excel (.xlsx) spreadsheet without loosing its style decoration.
Knowledge of HTML/CSS table is highly recommended as most of the properties syntaxes are applicable here.
I will make use of the CSV table that contains names of Nigerian Distinguished Senators as seen below. Feel free to make use of your own table of choice, the concept is what matters not the table data per se.
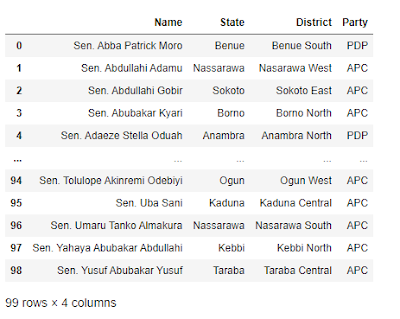
Let see how we can change the default table above to our liking...
df_table = pd.read_csv(r"C:\Users\Yusuf_08039508010\Desktop\Distinguished Senators.csv")

df_table

Let see how we can change the default table above to our liking...
Styling the entire table using: set_table_styles() function
Using the function "set_table_styles()", we can style the entire table (i.e: header, columns, rows, border etc.) by applying CSS styling tags.# Template...
# { '...':'...', '...':[(...), (...), (...)] }
# { 'selector':'th/td/tr:nth-of-type(odd/even)', 'props':[('pro1', 'value'), ('pro2', 'value'), ('pro3', 'value')] }
# Styling the entire table...
df_table.style.set_table_styles([
# Style table head...
{'selector':'th',
'props':[('background', '#123000'), ('color', 'white'), ('font-size', '15px')]
},
# Style table row/column... border option: solid, dashed, dotted
{ 'selector':'td', 'props':[('border', '2px dotted green'), ('', '')] },
# Style nth odd/even rows....
{ 'selector': 'tr:nth-of-type(odd)',
'props':[('background', 'white'), ('border', '2px dashed #D0D0D0')] },
])

The code above output this table styled below...

We can add hover style like so...
... {'selector': 'td:hover',
     'props': [('background-color', 'gray'), ('font-size', '2em')] },

    {'selector': 'tr:hover',
     'props': [('background-color', 'yellow')] }, ...
set_properties() function
df_table.style.set_properties(**{
    'background-color':'cyan',
    'color':'brown',
    'border':'2px solid black',
})
The set_properties() function could also be used to style the table as seen.

With set_properties() option, you can export/save the styled dataframe to .xlsx excel file.
Conditionally color column based on value
Lets say we want to color the 'party' column. Where red color is for PDP, blue color is for APC and others are yellow color.
# Define party color function...
def conditinal_color(cell):
    if cell == 'APC':
        color = 'blue'
    elif cell == 'PDP':
        color = 'red'
    else:
        color = 'yellow'

    return f'background-color:{color}'


# Apply style...
df_table.style.applymap(conditinal_color)
To color the text instead of the background, change the syntax like this...

df_table.style.apply(lambda x : ['background:red' if x == 'PDP' else 'background:blue' for x in df_table.Party], axis=0 )def party_color_func(x):
# return ['background:red' if x == 'PDP' else 'background:blue' for x in df_table.Party]
return ['background:red' if x == 'PDP' else 'background:blue' if x=='APC' else 'background:yellow' for x in df_table.Party]
df_table.style.apply(party_color_func, axis=0)
Other Resources
No comments:
Post a Comment