Hello there,
It is no longer new that most aesthetically pleasing maps out there have some of it elements accomplished with photo or graphics editing software.
In this post, you will see the important of having a graphics editing tool in your GIS tool set. We will use QGIS to generate the maps and then use GIMP to animate the maps for to present the map to our potential client.
Have a feel of what an animated map is below. It is the map of edo state, Nigeria displaying various levels of details on a single GIF image file.

Animated maps are good for showing time series data. Basically, this may involves illustrating the changing of same object over time in the same area or the simultaneous movement of different objects across an area over time.

As seen above, the table mapped with a nice legend by the side. However, this is better communicated and comprehended using an animated map. Let's prepare the animated map in GIF image format.
Firstly, we have to create the map frames in QGIS for the animation. We will have the first frame as an empty map where no state exists in the country then followed by the first set of states, second set, until the last set which make up the current 36 states in the country. That is: 27 May 1967 (6 states), 3 February 1976 (11 states), 23 September 1987 (2 states), 27 August 1991 (12 states) and 1 October 1996 (6 states)
At the time of independence in 1960, Nigeria was a Federal State of three Regions: Northern, Western, and Eastern (see details here).
From the history of the country, there are five number of events that lead to creation of more states at various at points as seen above; 6 states in 1967, 11 states in 1976, 2 states in 1987, 12 states in 1991 and 6 states in 1996. So, it means we are going to have five number of map layers for the animated map.
In QGIS, create the map layers and export them on the same size in PNG format.

Import the maps into GIMP and create the GIF as follow:-
Load all the maps into GIMP layer arranged in other which they will be displayed (in this case from 1967 to 1996).

Since the layers will have different displaying time, lets assign the display time for each layer by editing the layer's name with something like "(1000ms)" at the end of the name as seen below.

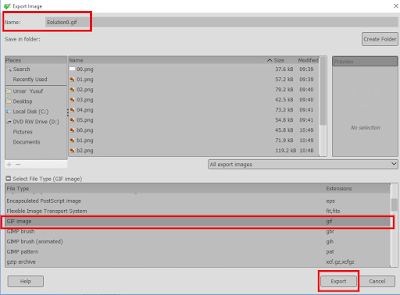
Export the image as GIF by going to File >> Export As... (Shft+Ctrl+E) and select the appropriate options.

The end result should look like below in .GIF image format.

That is it!
Hope you enjoyed reading this tutorial... share it!
It is no longer new that most aesthetically pleasing maps out there have some of it elements accomplished with photo or graphics editing software.
In this post, you will see the important of having a graphics editing tool in your GIS tool set. We will use QGIS to generate the maps and then use GIMP to animate the maps for to present the map to our potential client.
Have a feel of what an animated map is below. It is the map of edo state, Nigeria displaying various levels of details on a single GIF image file.

Animated maps are good for showing time series data. Basically, this may involves illustrating the changing of same object over time in the same area or the simultaneous movement of different objects across an area over time.
Animating the "Evolution of Nigerian states"
The table on this Wikipedia page shows a listing of Nigeria's states and the dates of their creation.
As seen above, the table mapped with a nice legend by the side. However, this is better communicated and comprehended using an animated map. Let's prepare the animated map in GIF image format.
Firstly, we have to create the map frames in QGIS for the animation. We will have the first frame as an empty map where no state exists in the country then followed by the first set of states, second set, until the last set which make up the current 36 states in the country. That is: 27 May 1967 (6 states), 3 February 1976 (11 states), 23 September 1987 (2 states), 27 August 1991 (12 states) and 1 October 1996 (6 states)
At the time of independence in 1960, Nigeria was a Federal State of three Regions: Northern, Western, and Eastern (see details here).
From the history of the country, there are five number of events that lead to creation of more states at various at points as seen above; 6 states in 1967, 11 states in 1976, 2 states in 1987, 12 states in 1991 and 6 states in 1996. So, it means we are going to have five number of map layers for the animated map.
In QGIS, create the map layers and export them on the same size in PNG format.

Import the maps into GIMP and create the GIF as follow:-
Load all the maps into GIMP layer arranged in other which they will be displayed (in this case from 1967 to 1996).

Since the layers will have different displaying time, lets assign the display time for each layer by editing the layer's name with something like "(1000ms)" at the end of the name as seen below.

Export the image as GIF by going to File >> Export As... (Shft+Ctrl+E) and select the appropriate options.


The end result should look like below in .GIF image format.
That is it!
Hope you enjoyed reading this tutorial... share it!
No comments:
Post a Comment